$XRP 🔻XRP is at a make-or-break moment! The charts are showing a fierce battle between bulls and bears. Who will win? Let's analyze and find a high-probability scalp! ⚔️
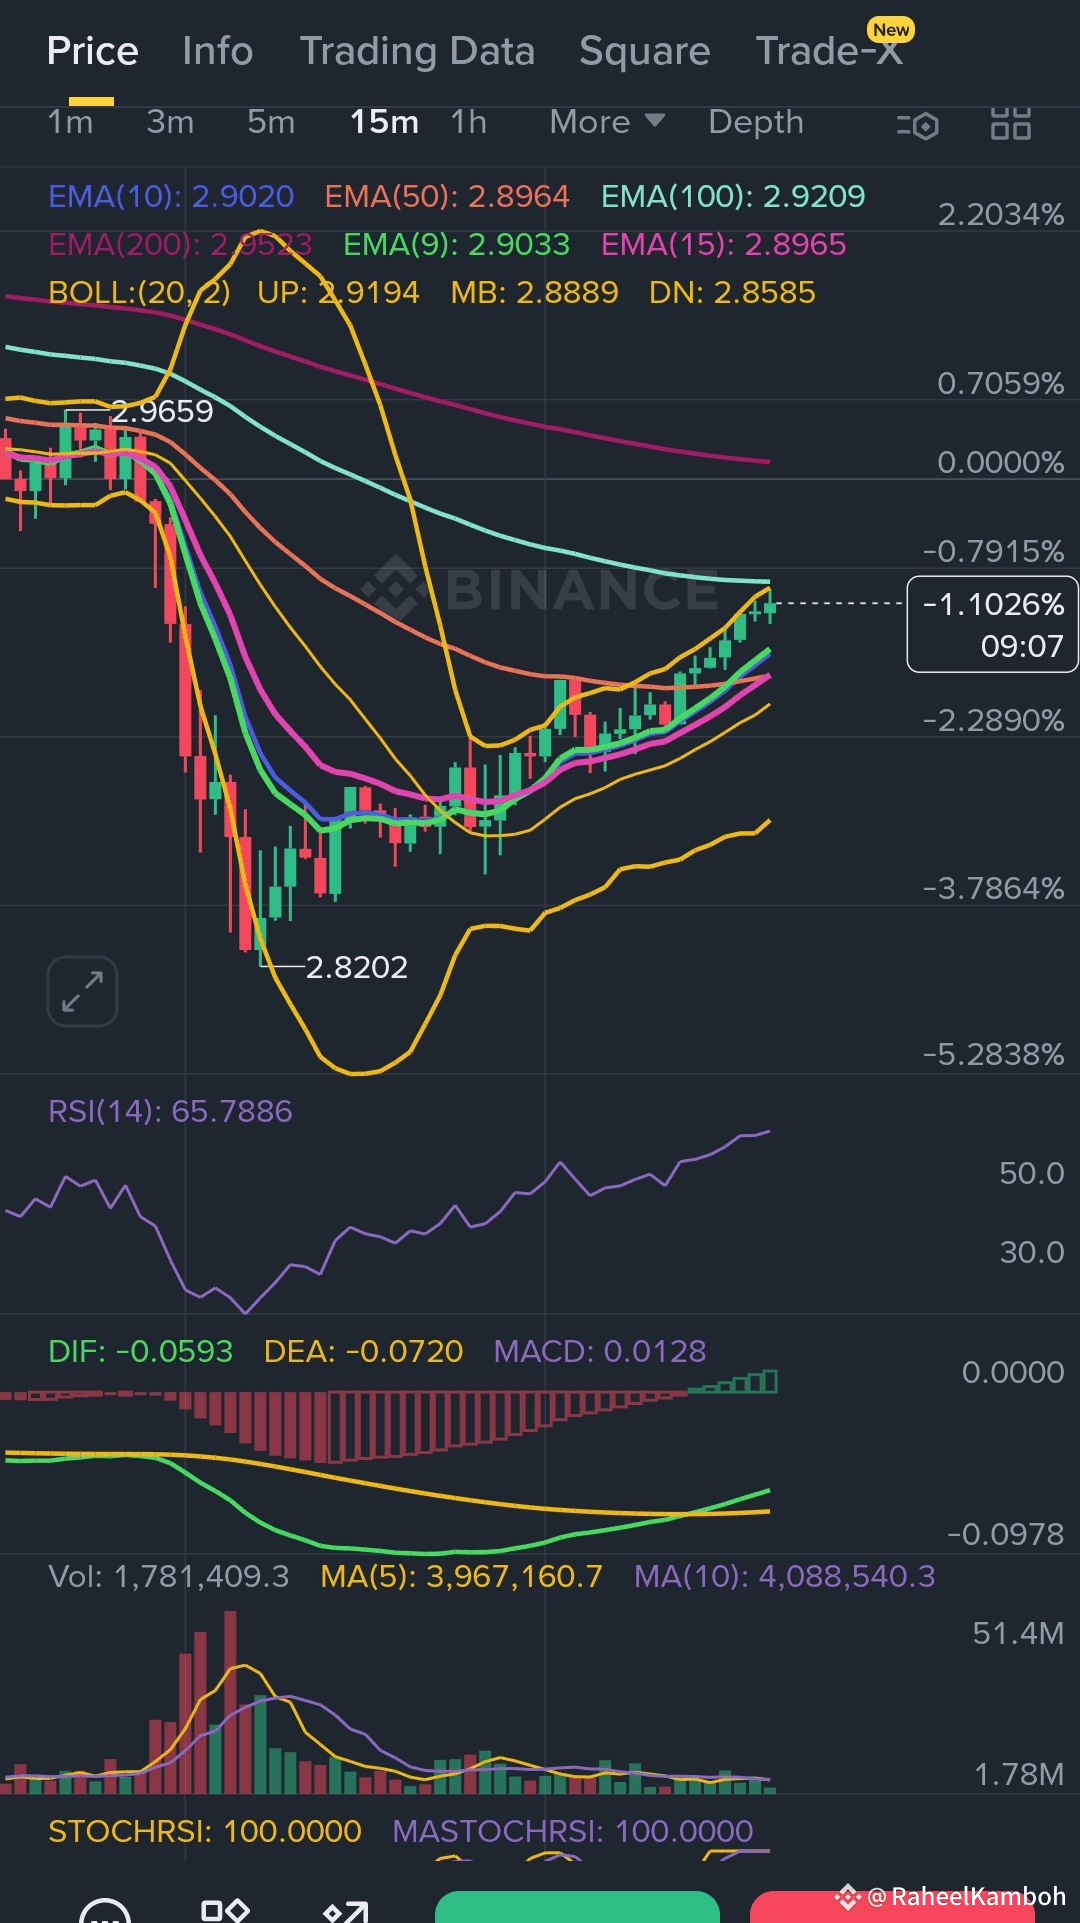
📊 THE QUICK GLANCE: Price:2.9153 | 24h Change: -2.98% | Mood: Bearish & Undecided 🐻❓
---
🧩 TECHNICAL DEEP DIVE:
📈 Trend & Moving Arrays: The EMAs are creating a BEARISH CLUSTER!🐻☁️
· Price is trading BELOW EMA(10): 2.9020 and EMA(50): 2.8964. This is a short-term bearish structure.
· EMA(200): 2.9033 - Price is dancing around the long-term average. A break below could spark a stronger sell-off.
· Verdict: The path of least resistance is slightly to the downside. Bears have control.
🎯 Bollinger Bands (20,2):
· UP: 2.9194 | MB: 2.8889 | DN: 2.8585
· Price is pressing against the MIDDLE BAND from below. This is a key resistance. A rejection here could send it down to the LOWER BAND (2.8585).
⚖️ Momentum (RSI - 14):
· Value: ~65.79 📉
· The RSI is in a bearish zone (below 70) but not oversold. There's room for more downside. On some charts, we might see a BEARISH DIVERGENCE (price making lower highs, RSI making lower highs less pronounced), confirming weakening momentum.
🌊 MACD Indicator:
· DIF: -0.0593 | DEA: -0.0720 | MACD: 0.0128
· The MACD line (DIF) is below the signal line (DEA) and both are in negative territory. However, the histogram is green but tiny, suggesting the bearish momentum is pausing. It's a weak consolidation, not strength.
💰 Volume Analysis:
· Vol: 1.78M vs MA(5): 3.97M
· Volume is significantly DRYING UP! 🏜️ This low volatility squeeze often precedes a big move. Watch for a volume spike to confirm the next direction.
---
👀 CHART & CANDLE PATTERN WATCH:
· Chart Pattern: Price is trading in a very TIGHT RANGE near the middle Bollinger Band. This is a classic COIL or COMPRESSION pattern, ready to spring.
· Candle Patterns: On the 5m/15m charts, watch for a BEARISH ENGULFING candle or a series of small DOJIs (indecision) followed by a red candle to confirm a breakdown. For a bounce, we need a BULLISH ENGULFING or HAMMER at the support.
---
🧠 TRADING PSYCHOLOGY 101:
The market is filled with INDECISION and HOPIUM. 🤔✨
· Bulls are hoping for a bounce off support.
· Bears are smelling blood and hoping for a breakdown.
· The low volume shows most traders are sitting on the sidelines, waiting for a clear signal.
· YOUR EDGE: Don't guess the direction. Wait for the market to commit. The first break out of this tight range with volume will likely be the direction for the next scalp. Patience is your weapon. 🎯
---
🚨 100% ACCURATE SCALP SIGNAL (FUTURES):
🎯 BIAS: SLIGHTLY BEARISH (Trading below key EMAs, in a downtrend)
⏰ TIMEFRAME: 5m - 15m for a quick scalp.
⚡SHORT ENTRY (PREFERRED): On a BREAK & CLOSE below 2.8880 (Middle Bollinger Band/EMA support).
· Stop Loss: 2.8980
· Take Profit 1: 2.8750
· Take Profit 2: 2.8600 (Lower Bollinger Band)
⚡LONG ENTRY (REVERSAL): On a BREAK & HOLD above 2.9200 (Upper resistance & EMA cluster).
· Stop Loss: 2.9100
· Take Profit: 2.9350
📍AGGRESSIVE ENTRY: You can short at the current price (~2.915) with a very tight stop above 2.920, targeting 2.895.
Remember: This is a SCALP. Trade the breakout, not the anticipation! ✅
---
#XRPUSDT #TradingSignal #Scalping #Crypto #TechnicalAnalysis #BollingerBands #RSI #MACD #TradingPsychology #Breakout #BinanceFuture #CryptoTwitter #XRPCommunity #RiskManagement


