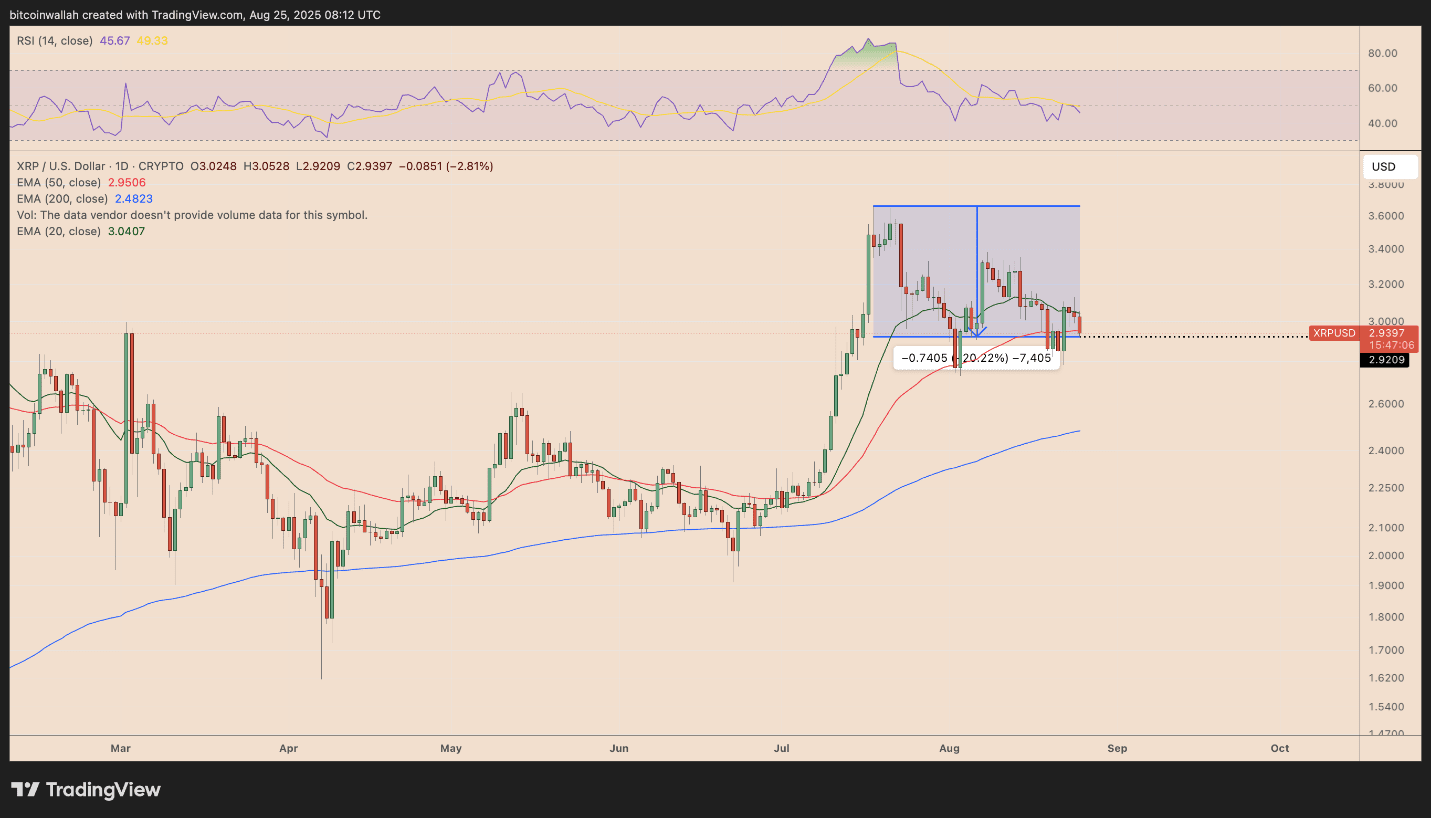
XRP has dropped over 20% since peaking near $3.66 in July, including a 3% decrease in the past 24 hours, pulling the price below the important psychological level of $3.
Can XRP reclaim the $3 level as support and continue to rise afterwards? Let's see what XRP analysts have to say.
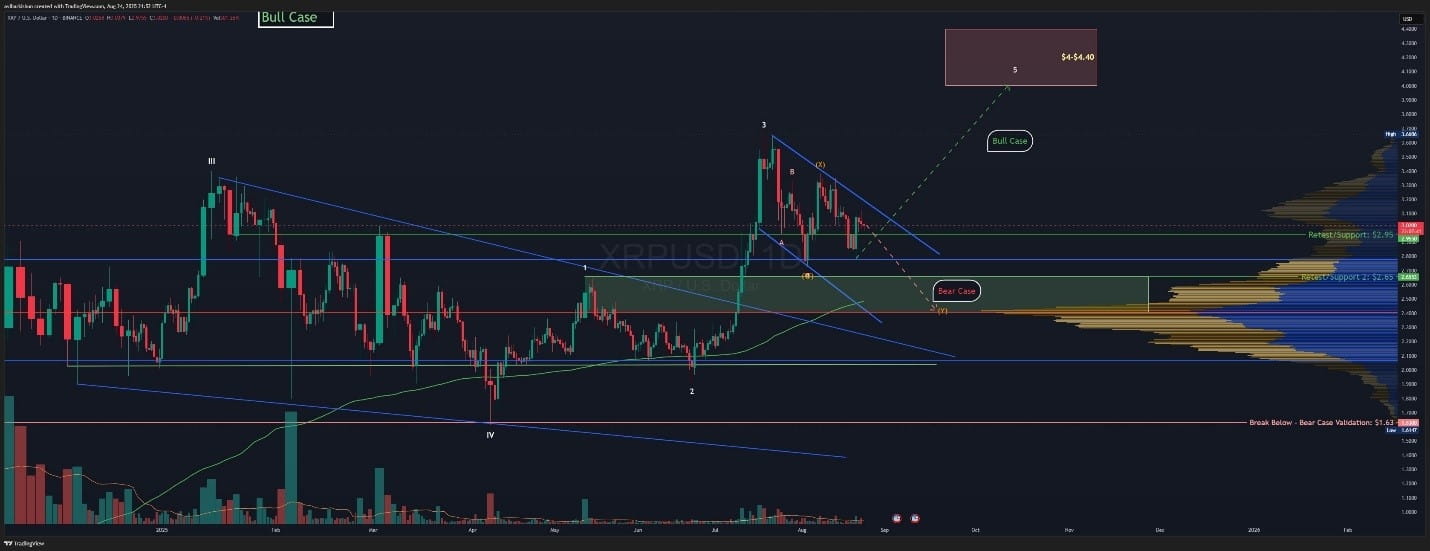
XRP aims for a recovery to $4.4
The XRP chart shows the possibility of a recovery to the $4–$4.4 range, as long as the coin holds support around $2.95, according to Elliott Wave analysis by Avi Harkishun.
The $2.95 level previously acted as resistance during the mid-2021 recovery and then became support when XRP broke out earlier this year.
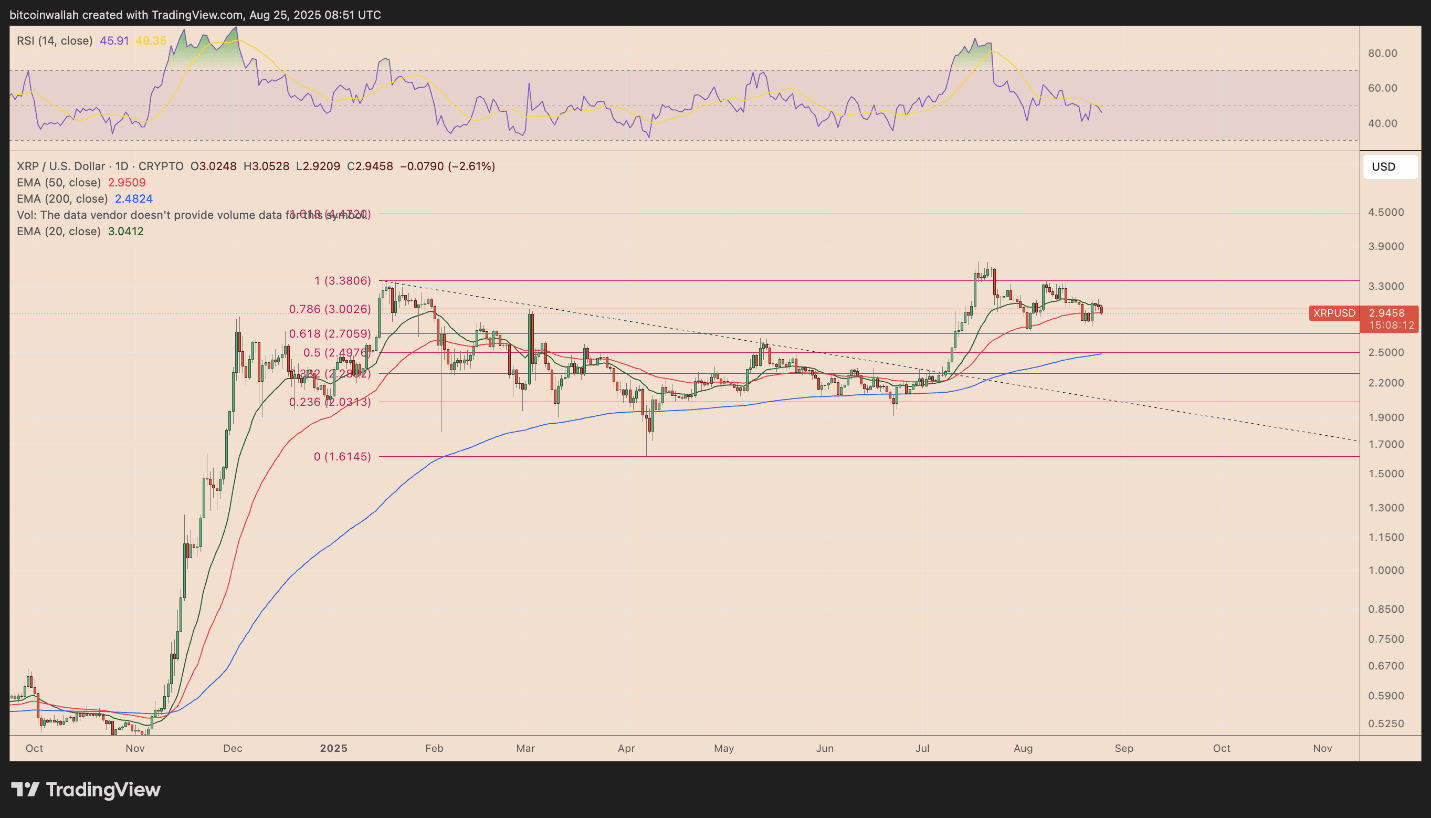
The target zone of $4–$4.4 coincides with the 1.618 Fibonacci retracement level, measured from the swing high near $3.38 down to the swing low around $1.61 of XRP.
Many chart analysts, including the anonymous analyst ThePenguinXBT, consider the high price levels in this range as a 'good long entry opportunity.'
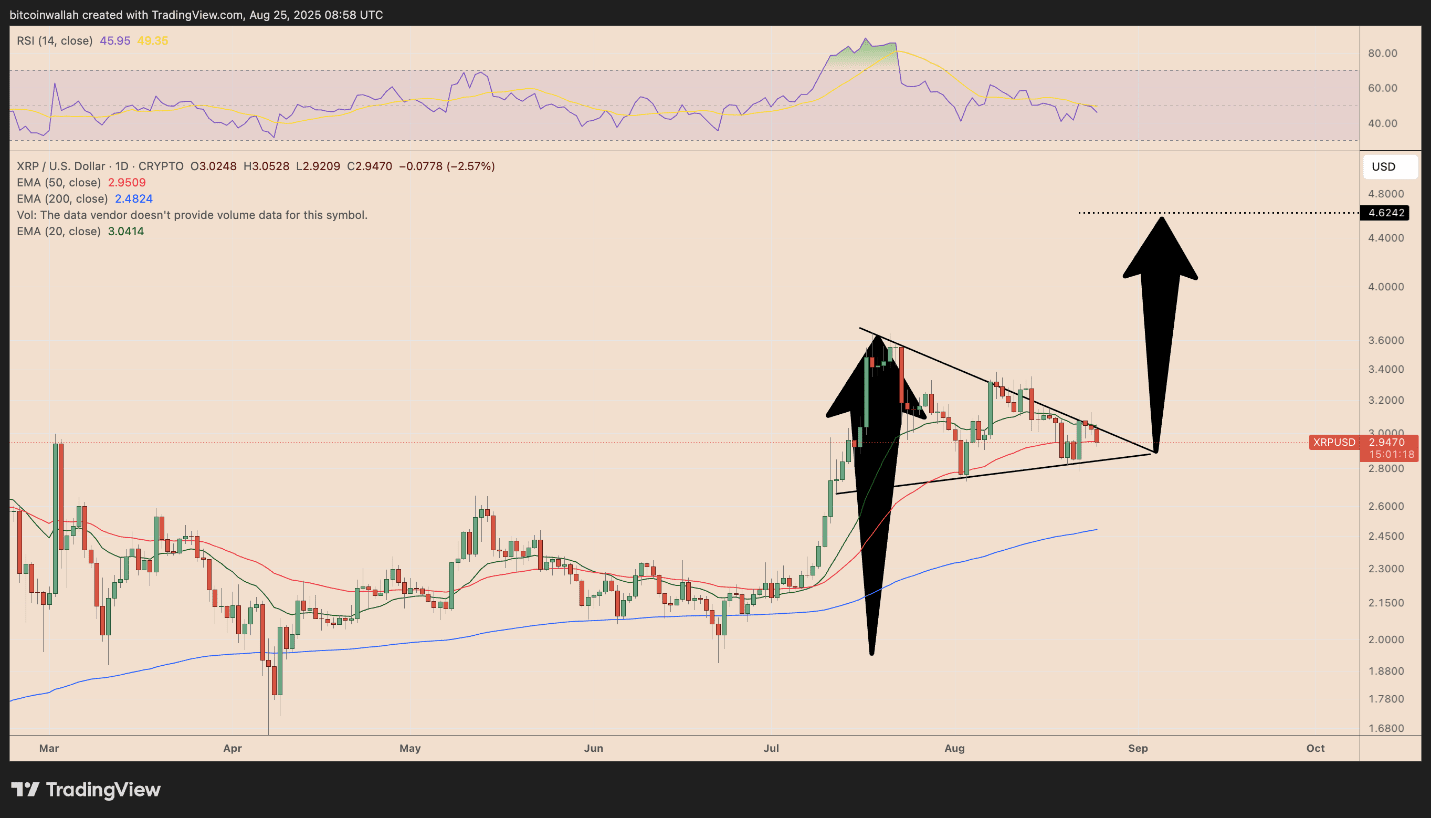
The prevailing bull flag pattern of XRP also suggests a potential breakout to $4.4, with a technical target above at around $4.62, as shown in the chart below.
The cup and handle model of XRP aims for $5.8
Another bullish signal comes from chart analyst AltcoinGordon, indicating a classic cup and handle pattern on XRP's daily chart.
The chart shows the price entering the 'handle' phase of the model, consolidating in a narrow range after a U-shaped recovery. Technically, this consolidation phase could be a preparation step for a breakout above the neckline of the cup and handle model, at around $3.8.
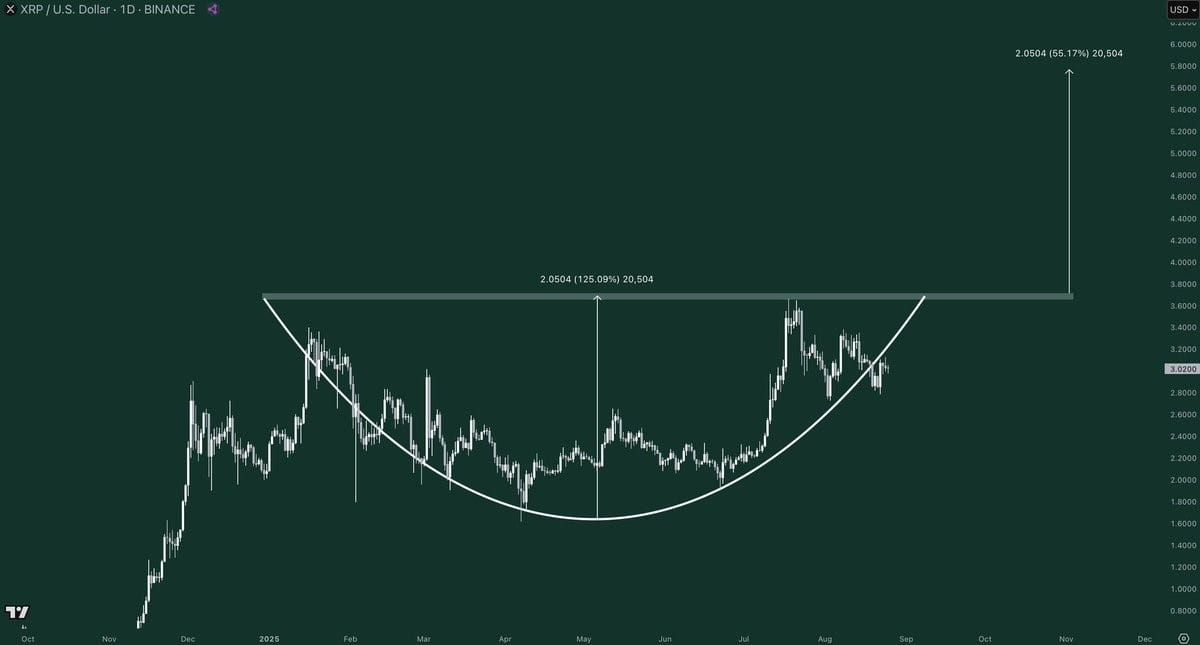
Based on the movement from the bottom of the 'cup' section, the expected target is near $5.8, equivalent to an increase of about 90% from the current price.
XRP must hold the support at $2.95
A drop below $2.95 could complete the pattern that Elliott Wave analysts refer to as the 'WXY correction,' according to Harkishun.
The WXY correction is a prolonged corrective pattern in which the price declines gradually in three linked waves rather than bouncing back quickly.
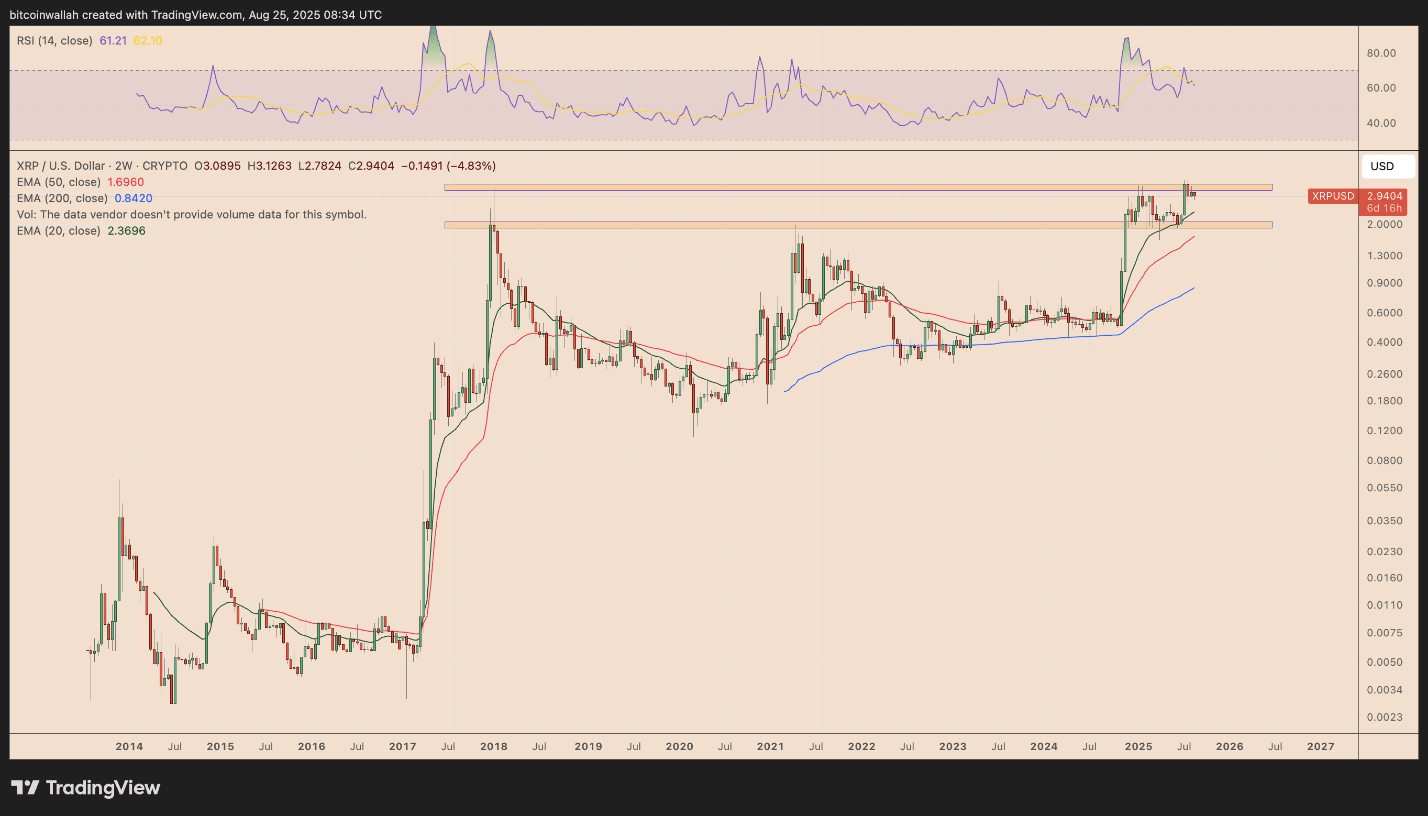
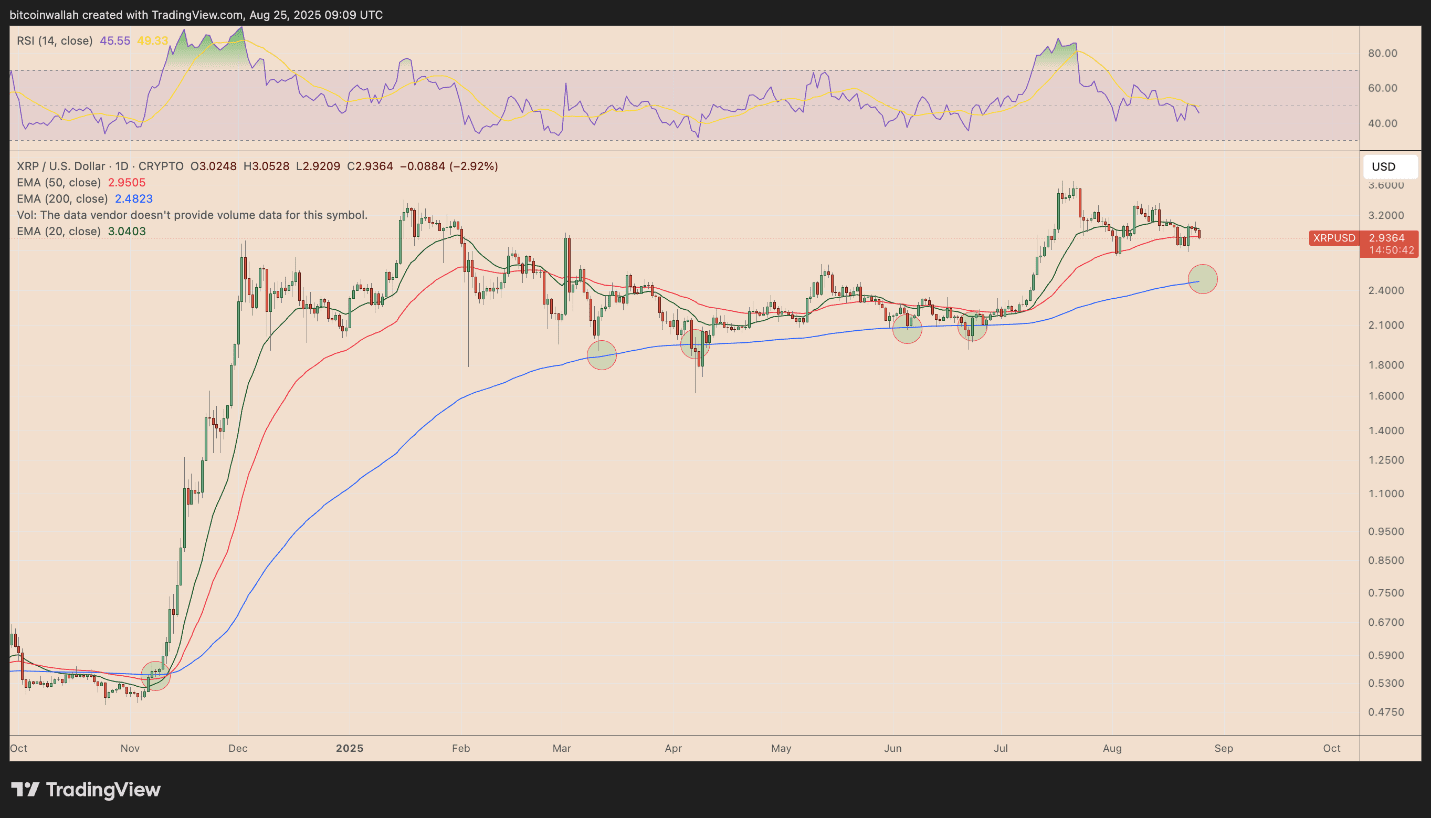
This could pull XRP down to around $2.4, a level that coincides with strong trading activity during the 2020–2021 period and aligns with the 200-day exponential moving average (EMA 200-day, the blue line in the chart below).
This makes the $2.4 level a reasonable support zone in a bearish scenario, where the likelihood of a bounce back is high.
