In this issue, we explain the wave theory channel and combine it with technical analysis of financial markets to comprehensively study the channel regarding channel lines.
Elliott once mentioned that parallel trend channels can often standardly mark the upper and lower boundaries of impulse waves. You should draw a price channel as early as possible to help determine the movement targets of the waves and provide clues for future trend developments.
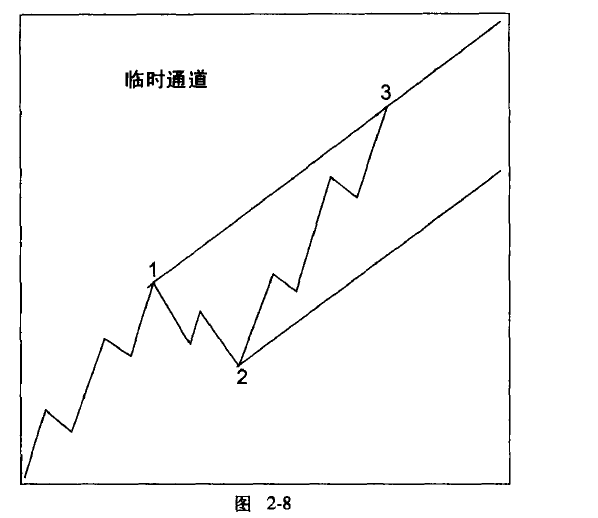
A primitive channel that drives a wave requires at least three reference points. When the third wave ends (how to determine the end of the third wave? Sometimes might judge it too early), first mark the two points of 1 and 3, then draw a parallel line to touch the marked point of 2. This structure provides an expected boundary for the fourth wave. (In most cases, the third wave will go very far, so its starting point is excluded from the final channel's contact point).
If the endpoint of the fourth wave does not touch the parallel line, you must rebuild the channel to estimate the boundary for the fifth wave. (Connect 2 and 4, draw a parallel line at vertex 3), which can generally predict the endpoint of wave 5. If wave 3 is exceptionally strong (almost vertical), then the parallel line drawn from its peak will be too high. As shown in the figure.
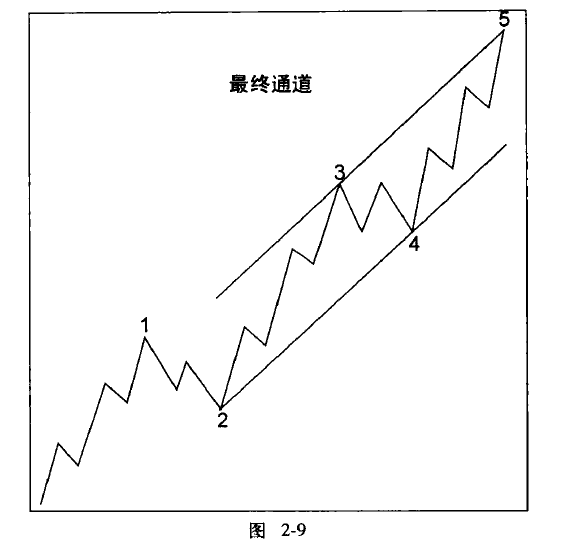
In the case where wave 3 is almost vertical, the parallel line touching the peak of wave 1 is usually more effective. Remember, under normal circumstances, the parallel channel formed by the endpoints of 2, 4, and the peak of 3 is generally the most effective. Only in the case where wave 3 is almost vertical do we adjust the channel, as shown in the figure below.
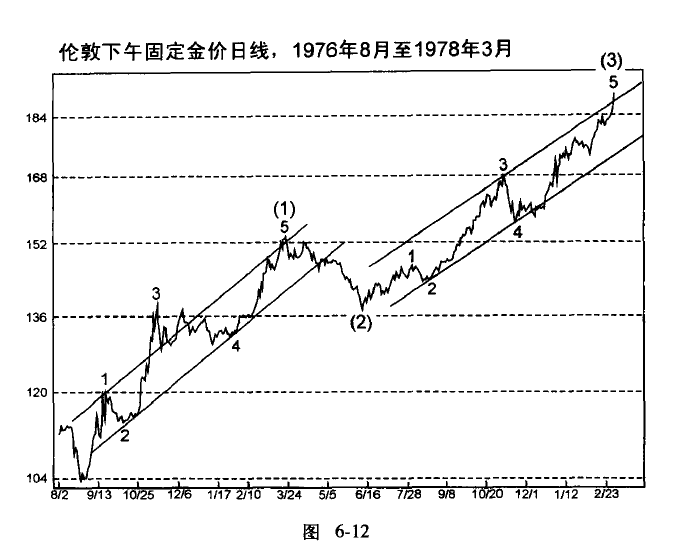
Always remember that the trends of all wave levels operate simultaneously. For example, sometimes the fifth wave of a large wave level within the fifth wave of a medium wave level will end when the trend of this wave level simultaneously reaches the upper boundary line. Alternatively, the crossing of super cycle wave levels may terminate right when the market reaches the upper boundary line of the cycle wave level.
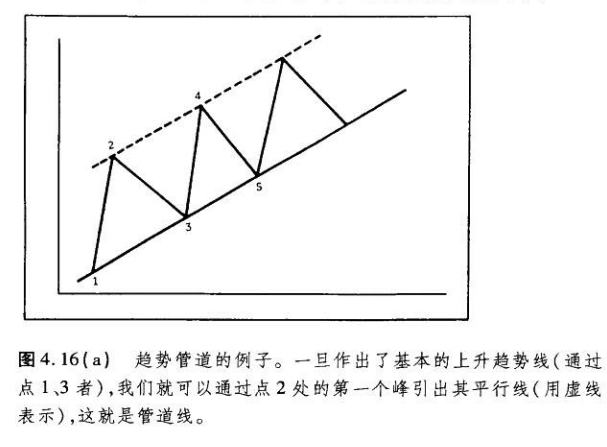
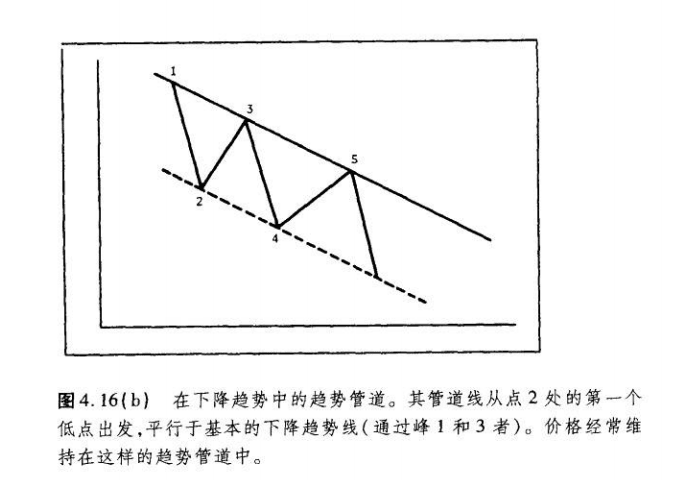
(Technical analysis of financial markets) Explanation and application of channels: Price trends are entirely confined between two parallel lines, one being the fundamental trend line, and the other being the channel line.
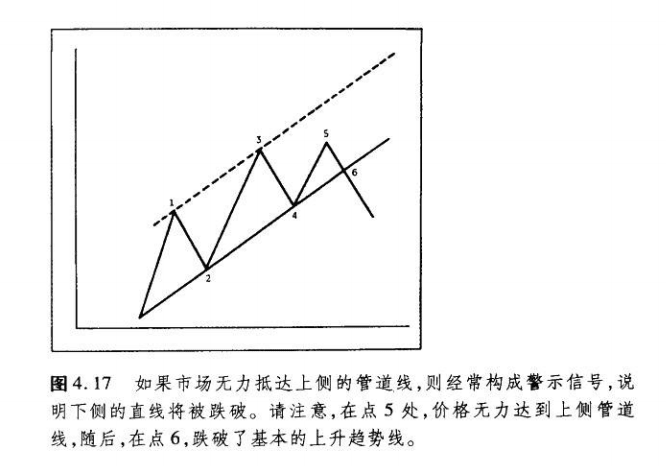
Application 1: The signal for identifying trend weakening using channel techniques is the situation where the price fails to reach the channel line, which is usually a warning signal. It means that the trend is about to change (accelerate or reverse), indicating a greater possibility of a breakthrough on the other side.
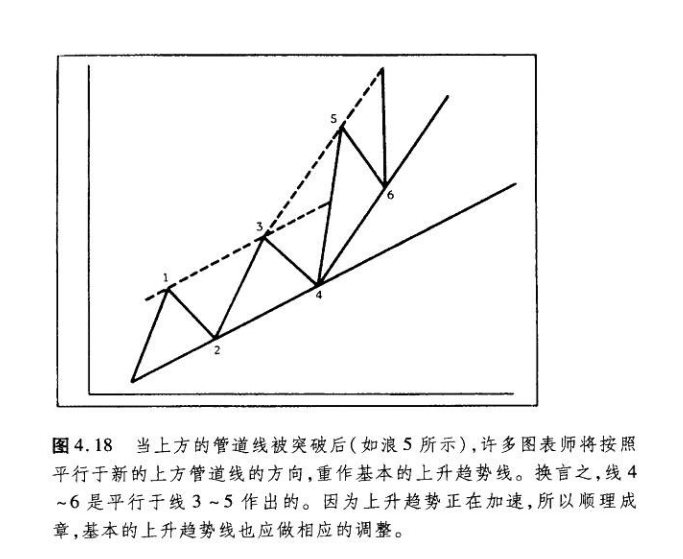
Application 2: Adjusting the fundamental trend using channel lines. If the price significantly exceeds the channel line of the upward trend line, it indicates trend enhancement.
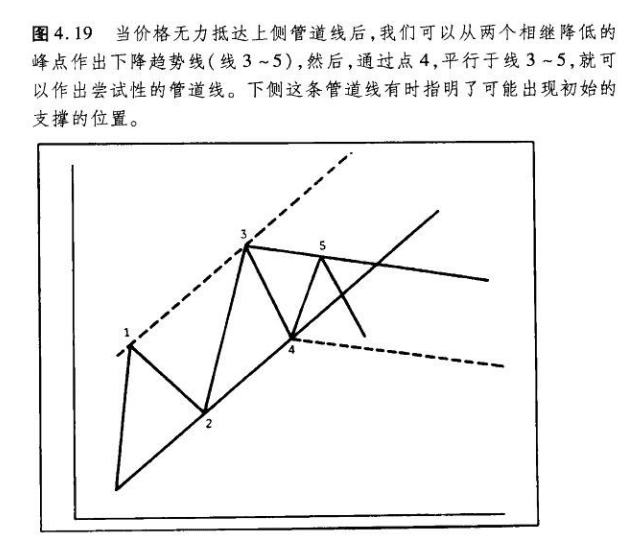
Similarly, in an upward trend, when the price fails to reach the upper channel line, a parallel line can be drawn based on the blocking line obtained by connecting the last two peaks, starting from the last upward rebound low point, as a new support line.
The channel line also has calculative significance: once a breakthrough occurs in the two manifestations of the price channel, the price will typically reach a distance equal to the channel width in the direction of the breakthrough.
Remember, among the two lines that make up the channel, the fundamental trend line is far more important and reliable than the channel line. In trend technical lines, the channel line is secondary.
