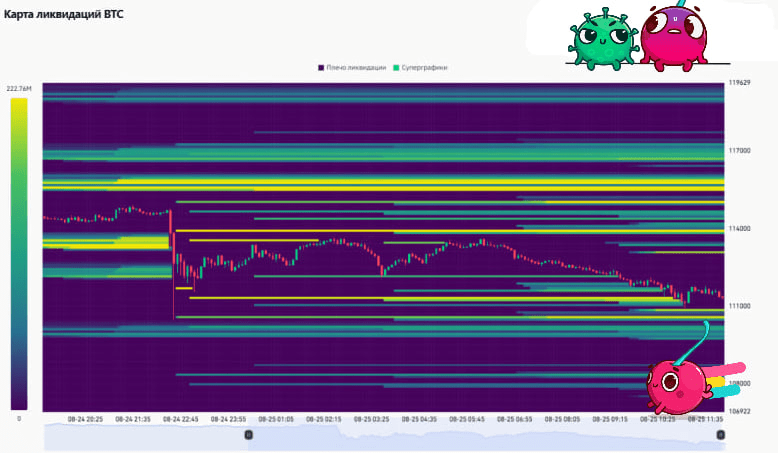
Analysis from the liquidation map #BTC 1 day (Liquidation HeatMap).
The screenshot reflects the density of liquidations and liquidity levels, where stop losses and limit orders may be concentrated.
________________________________________
1. Price forecast
• Short-term (1–3 days): BTC price is in the consolidation zone of $111,000–114,000 with increased liquidity. A strong liquidation skew is observed below $111,000, creating a risk of a downward stop-out to collect liquidity before a potential bounce.
• Medium term (1–2 weeks): the probability of continuing the downward movement to $108,000–109,000 (below liquidity clusters) remains, after which a return to $114,000–115,000 can be expected if holding above $111,000.
________________________________________
2. Support and resistance levels
• Support:
o $111,000 (key liquidation zone)
o $109,000
o $108,000 (deep liquidity level)
• Resistance:
o $114,000–114,500 (top of the liquidity zone)
o $117,000–117,500 (strong liquidity cluster, upper target for bulls)
________________________________________
3. Long scenario
• Entry: $111,200–111,500 (upon confirmation of the bounce)
• Exit (take-profit):
o First target: $114,000
o Second target: $117,000
• Stop-loss: $109,500 (below the liquidity zone)
• Risk/profit: ~1:2
________________________________________
4. Short scenario
• Entry: $114,000–114,500 (pullback to the resistance zone)
• Exit (take-profit):
o First target: $111,000
o Second target: $109,000
• Stop-loss: $115,500
• Risk/profit: ~1:2
________________________________________
5. Leverage size
• For working under these conditions:
o Optimally: x3–x5 (average)
o For aggressive trading: up to x10, but with the risk of getting stopped out on false breaks
________________________________________
6. Probability of scenarios
• Long: 45% (only if holding above $111,000 and confirming demand)
• Short: 55% (more likely movement to $109,000–108,000 to collect liquidity before a rise)
________________________________________
📊 Conclusion:
BTC still looks weak, and the market tends to stop out below $111,000. A more reliable strategy is to wait for a downward move to the zone of $109,000–108,000 and look for longs there. For active trading, one can try shorting from $114,000, as the probability of a decrease is slightly higher.
🔥 Insights @INVESTIDEAUA : Intraday trading, LONG/SHORT strategies, SPOT, TRAINING.
🎯 I would be pleased to know that my work was not in vain.
🎯 I would appreciate a subscription
🎯 Your support and feedback always inspire me to continue sharing quality content.