Come on, let's start with a multiple-choice question:
How is a trend initiated? In other words, where does the starting point of a trend begin?
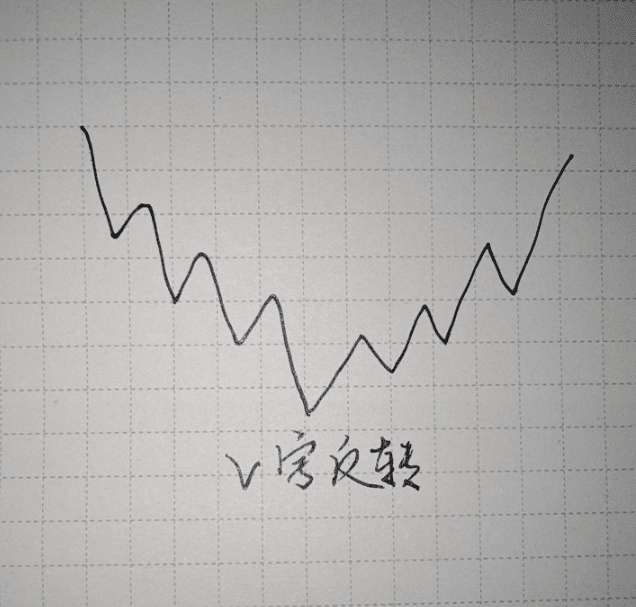
A: All the way to the bottom, receiving a reversal, commonly known as a V-shaped reversal, marking the start of a new trend.
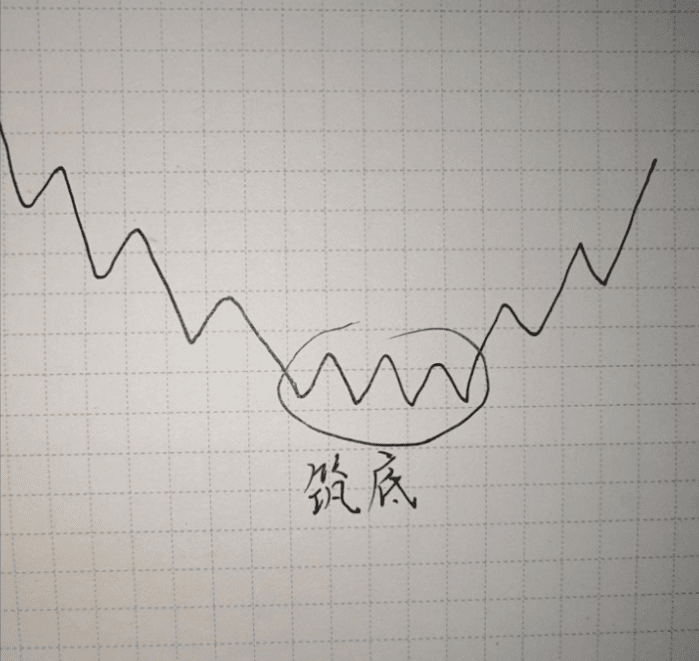
B: After a period of sideways movement, a breakout occurs in the opposite direction of the prior sideways direction, initiating a trend in the opposite direction (and the previous sideways phase is renamed as a bottoming or topping phase).
C: After a period of sideways movement, a breakout occurs in the same direction as prior to the sideways phase, initiating a trend in the same direction (the earlier sideways phase is renamed as the central zone). Is this a new trend or a continuation of the original trend?
Answer:
Choosing option A directly leads to inherent losses. Some may feel that A is incorrect but typically operate like A. Don't believe it? Look at your trades, especially liquidation trades and consecutive loss trades. However, the occurrence of case A often provides us with excellent opportunities (more details later).
Choosing B and C indicates that you have just touched the threshold of trading, and the subsequent distinction between profit and loss lies in handling the single trade profit-loss ratio. If handled properly, long-term profits can be achieved.
Remember this valuable saying:
Trends mostly originate from sideways fluctuations. The longer the fluctuation lasts, the greater the probability of trend initiation. Once a trend is established, it is difficult to change (the right-side direction mostly follows the left-side direction).
OK, let's elaborate in detail!!!!
First, let's discuss the situation of option A:
A trend is validated by both bulls and bears (for example, in a downtrend, bears exert medium to long-term strength, while bulls also see long-term declines and thus only perform short-term operations). V-shaped or inverted V reversals require both parties to reach a consensus in the opposite direction again; how difficult is that? V-shaped reversals do exist in the market, but the probability is extremely low.
Therefore, always betting on V-shaped reversals often leads to questioning life!
As an individual, one fears both heights and lows, so they tend to buy at the bottom and sell at the top; this is simply human nature.
The emergence of A is accompanied by great operational opportunities. Why is that? How should it be operated?
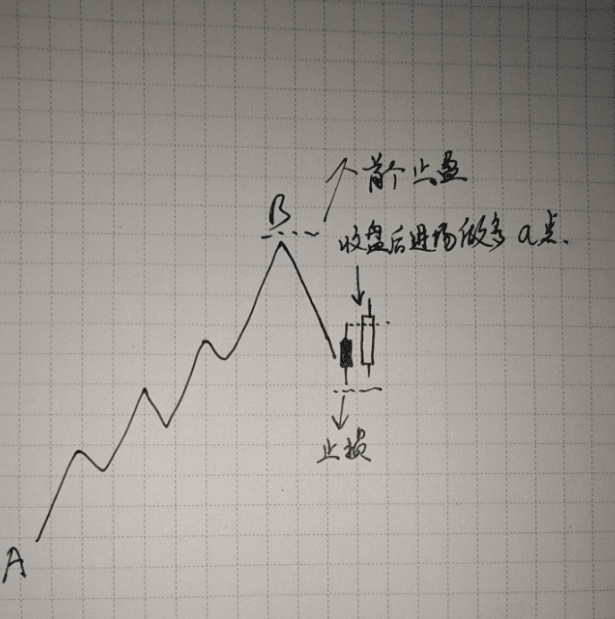
Without relying on moving averages or other technical indicators, operate like this:
Segment AB is a rising trend, with point B stopping the rise and turning down, which is the inverted V mentioned above. Patiently wait for a bullish candlestick to appear, with the highest point of that candlestick exceeding the highest point of the previous candlestick (a bullish engulfing pattern). After the bullish candlestick closes, enter long. This is the entry point for a, with the stop loss just below the lowest points of these two candlesticks and the first take profit target at point B.
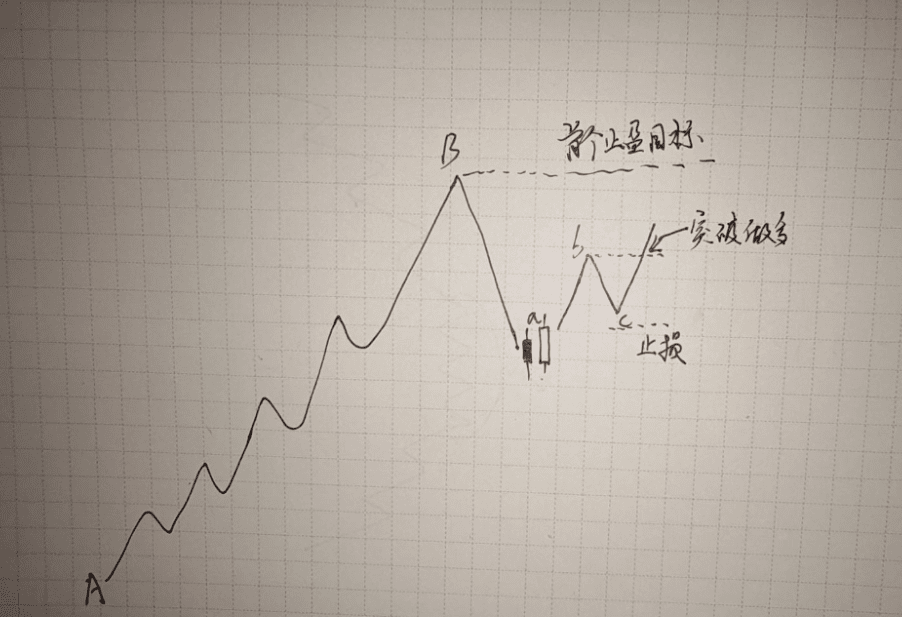
Entering at point a is quite aggressive. If you do not enter at point a, continue to wait until the price rises to point b before dropping again. After reaching point c, it stops falling and starts rising again. Once it exceeds point b again, enter long. This is the entry point for b, placing the stop loss just below point c and the first take profit target at point B.
Entering long at points A and B follows the direction of AB, which is called going with the trend and knowing how to do so.
Now let's talk about the situation of choosing point B:
Why is option B more reliable than option A despite both running in the opposite direction? Because during the sideways fluctuation process, the energy of both bulls and bears gradually depletes and balances. The longer the sideways period lasts, the more the probabilities of moving up or down converge towards 50%. However, the trend often just enters a larger fluctuation area...
Similarly, without relying on moving averages or other technical indicators, operate like this:
Segment AB is a rising trend, with point B stalling, leading to sideways fluctuations that form a box consolidation area with B as the upper boundary and C as the lower boundary. After some time, when the price breaks down through C, should you enter a short position? It is best not to, as a new trend has not been established yet. Entering at this point would still be against the trend.
Choose to wait. When it reaches point D, it stops falling and starts rising, but the price has not returned to the BC range; instead, it turns down again. When it breaks below point D, enter a short position, aiming for a target at the 50% position of segment AB or a support level of segment AB.
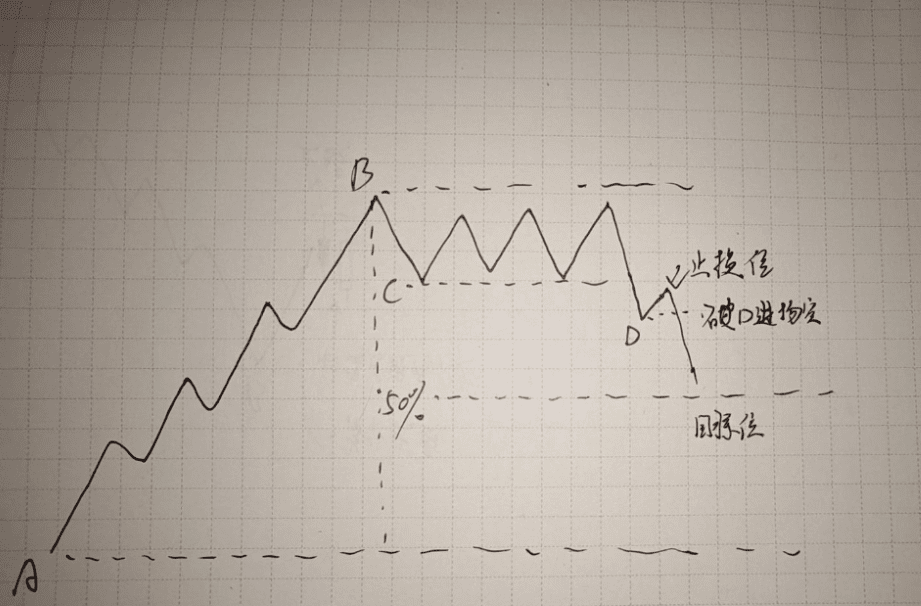
Why is it at the 50% position? Because this is the watershed for forming a deep pullback. From breaking downward through C to around 50% of AB, it may return to the original trend of AB or form a larger fluctuation area.
If it breaks below 50%, then continue to view it as bearish, treating it as an established downtrend. What you need to do is wait for the market to prove you wrong.
Finally, let's discuss the situation of option C:
Looking back at that valuable saying:
Trends mostly originate from sideways fluctuations. The longer the fluctuation lasts, the greater the probability of trend initiation. Once a trend is established, it is difficult to change (the right-side direction mostly follows the left-side direction).
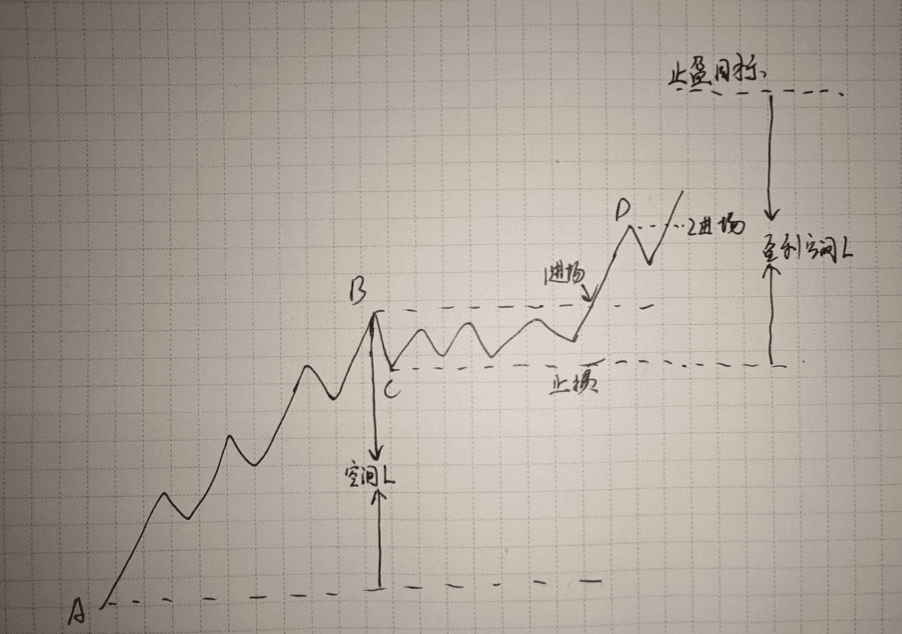
Segment AB is a rising trend, with point B stalling, leading to a sideways fluctuation area with BC as the upper and lower boundaries. After some time, when the price breaks above point B, should you enter a long position? Of course, you can! Place the stop loss just below the C boundary. The worst that can happen is a fake breakout, leading to a return to break even, ultimately resulting in a stop loss. The benefit is not missing out; if it is a true breakout, you can enter a new rising trend.
If you think entering at the breakout of point B is too aggressive and are afraid of being trapped by a fake breakout, then continue to wait. Wait until it drops back to D before breaking through point D again to enter the market.
Place the stop loss just below point C, and the take profit target is the same height as the distance of AB (from point C, C - take profit target = AB space).
It is better to teach someone to fish than to give them a fish.
Whether new or experienced, investors at Biquan gain not only financial returns but also growth in investment knowledge and experience.
In all the investment processes of loyal supporters, we not only provide investors with analytical thoughts on market trends, basic knowledge of market observation, and various investment tools usage, but we also bring exciting fundamental interpretations, sorting out the chaotic international outlook, and identifying various investment forces.
Allow yourself to be both a winner and an expert in investing! As the saying goes, if you don't know what to do in a bull market, click on Awen's avatar, follow, and get free shared strategies for bull market spot and contract passwords.

