The Nakamoto coefficient is a tool for assessing the degree of decentralization. It was proposed in 2017 by the former CTO of the cryptocurrency exchange Coinbase, Balaji Srinivasan, in collaboration with Leland Lee.
In the dedicated tool article Quantifying Decentralization, they compared excessive centralization with inequality in the economy, relying on the synergy of two indicators:
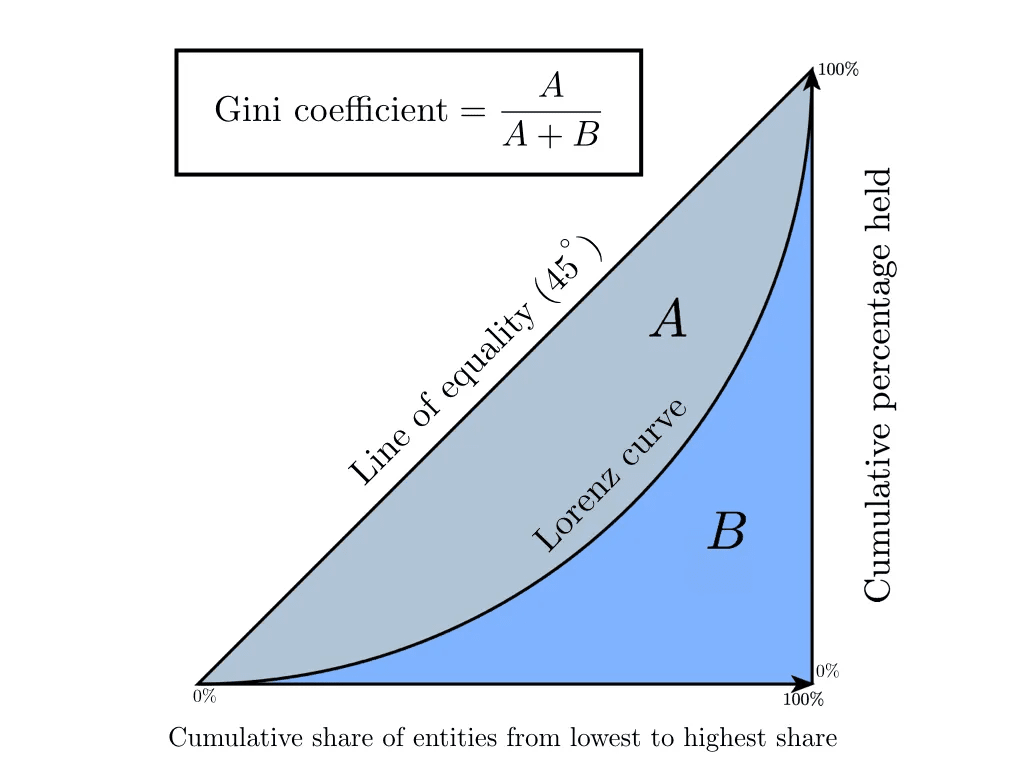
Lorenz curve — a graph of a mathematical function showing the distribution of income or wealth. The greater the deviation from the line, the stronger the inequality. In the blockchain industry, it can reflect the distribution of computational power or tokens among network participants;
Gini coefficient — a statistical measure of the stratification of society by income distribution. Ranging from 0 to 1, it indicates the degree of inequality.
the main idea is as follows:
list the key subsystems of a distributed system;
determine the number of individual elements for compromise in order to gain control over each of them;
use the minimum value from the obtained numbers as an indicator of effective decentralization.
The Nakamoto coefficient reflects the minimum number of organizations (mining pools, validators, or other stakeholders) necessary to collectively disrupt or take control of the network's operation. By calculating this indicator for any network, one can understand how difficult it would be for attackers to target it.
What data is used to calculate the coefficient?
Srinivasan and Lee noted the influence of subsystems on the accuracy of the calculation. To apply the concept to the realm of public blockchains, it is necessary to separate the system from its elements.
In the case of the Bitcoin network, six subsystems of decentralization are identified:
Mining. In PoW networks, miners confirm transactions. The wider the distribution of mining power, the higher the decentralization. In PoS systems, validators are similarly assessed.
Software clients. The diversity of clients reduces the risk of a single point of failure.
Developers. Distributed participation of engineers in blockchain updates protects against control capture by a small group.
Exchanges. A large concentration of tokens on a few trading platforms increases the risk of manipulation.
Nodes. Nodes distributed across countries and operators make the network more resilient.
Token ownership. The distribution of large balances $BTC is assessed.
What is the Nakamoto coefficient for Bitcoin and #Ethereum ?
The calculation process includes several stages:
Identification of key subjects. Identification of key players in the network — mining pools, validators, node operators, token holders.
Assessment of the level of control. Analysis of the distribution of power, for example, hash rate in PoW or stake shares in PoS.
Summation of elements. Sorting participants in descending order and counting their number to reach 51% — the critical threshold for an attack on the network.
For example, consider Bitcoin with the following structure of mining pools as of May 1, 2025:
Foundry USA — 30.6% of the hash rate;
AntPool — 17.1%;
ViaBTC — 15.4%;
F2Pool — 9.8%;
MARA Pool — 5.6%;
The rest — 21.5%.
Counting:
Foundry USA = 30.6%;
AntPool (30.6% + 17.1% = 47.7%);
ViaBTC (47.7% + 15.4% = 63.1%).
When adding the pool #ViaBTC the final value exceeded the 51% threshold with a rate of 63.1% — summation completed. According to the calculations, three pools control more than half of the network, which means the Nakamoto coefficient for Bitcoin is 3.
Given the decentralized nature with a large number of working nodes in Bitcoin, the distribution of computational power among pools can create risks for the network. The task of the Nakamoto coefficient is to highlight weak elements.
How else is the Nakamoto coefficient used?
PoS networks like Sui and Aptos operate on a mixed DAG—BFT consensus mechanism architecture. To confirm a block in such systems, consensus from 2/3 of validators is required. In other words, control over more than 66.6% of tokens effectively allows management of block creation.
According to the analytical resource Nakaflow, the Nakamoto coefficient indicators among PoS networks are varied. As of May 1, 2025, one of the lowest values — just 4 — is observed for Polygon. Average values range from 20 to 35 for the blockchains Solana, Cardano, Avalanche, THORChain, and Avail. The record holder by a large margin is the Polkadot parachain network with a Nakamoto coefficient of 173.