Currently, the altcoin trends in the crypto market are showing significant divergence, with XRP and Dogecoin exhibiting bullish momentum, while Chainlink and Stellar are facing technical pressures, making the key levels of different coins a market focus.
XRP triangle compression is awaiting a breakout, targeting 4.5 USD
Analyst Steph Is Crypto's chart shows that XRP has formed a symmetrical triangle structure on the daily chart, following a five-wave Elliott wave pattern. This formation began after the historical high set in July, with highs gradually declining and lows steadily rising, indicating that volatility is tightening, which means a breakout is imminent.
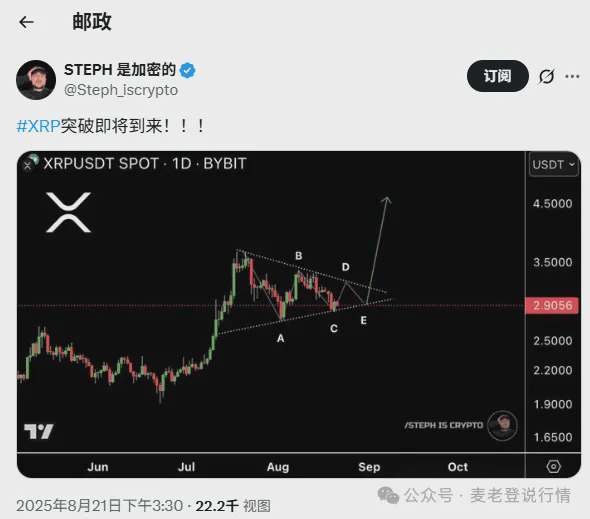
Currently, XRP is priced at 2.83 USD, at the E wave stage of the triangle's end. The chart shows that the upward target post-breakout points to 4.5 USD; if it can close above the upper boundary of the triangle on the daily chart, it will confirm the bullish trend; if it breaks below the lower support, it may extend consolidation or trigger a drop. As the structure approaches its conclusion, the market awaits a clear breakout signal.
Dogecoin 0.25 USD meets resistance, aiming for 1 USD after stabilization
Dogecoin (DOGE) soared 85% to 0.60 USD after a long-term symmetrical triangle breakout, now facing resistance at the key level of 0.25 USD, oscillating in the 0.229-0.25 USD range. Technical indicators show an RSI of 55.18 indicating mild bullishness, while MACD momentum is weak, requiring increased volume to confirm the trend.
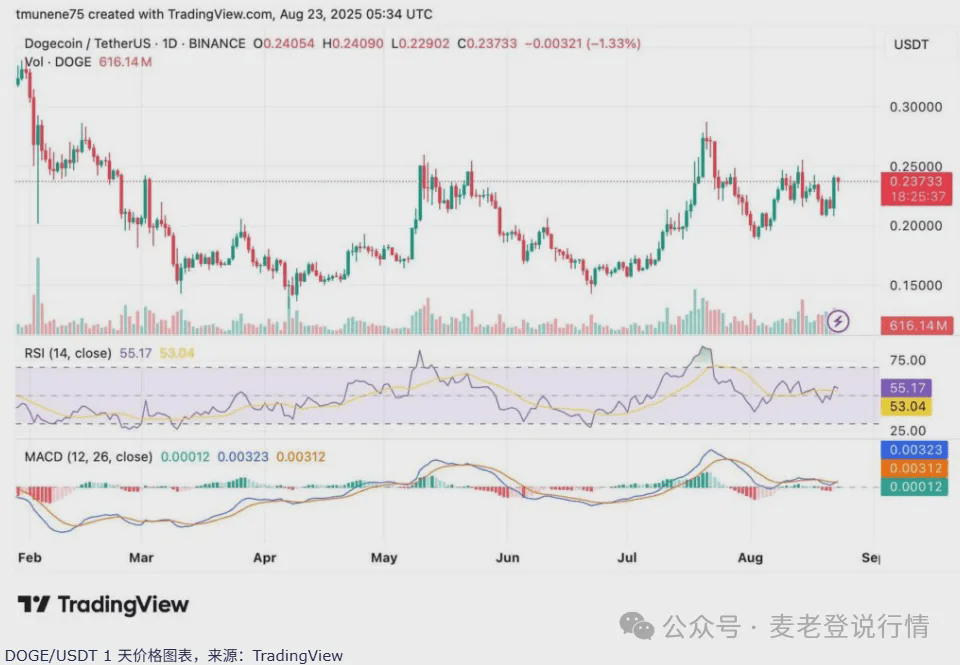
In the short term, if the daily closing price stabilizes above 0.25 USD with volume support, a rise to 0.28-0.30 USD is expected; key support levels are at 0.21-0.22 USD, and a drop below may test 0.18-0.19 USD. The medium to long-term target aims at 0.75-1.00 USD, but continuous breakthroughs of resistance levels and sustained momentum are required.
Chainlink is at a critical decision point, with 27.3 USD as a bullish-bearish dividing line
Chainlink (LINK) recently broke through 25 USD and tested 27 USD, encountering resistance and pulling back, currently near the lower boundary of the rising channel, facing a directional decision. Analysts point out that if it cannot break through the 27.3 USD resistance, it may test the support at 15-17 USD; if it stabilizes at this level with volume, it could aim for the upper channel at 45-52 USD, potentially doubling in price.
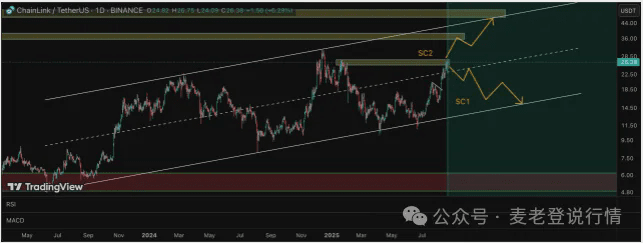
Currently, focus should be on the 27.3 USD resistance and 18-19 USD support. Historical trends show that this area has active selling pressure, and if selling pressure decreases during an upward movement and breaks through resistance, it may signal the end of selling and pave the way for subsequent increases.
Stellar technicals are bearish, beware of 40% downside risk
Stellar (XLM) has recently experienced a noticeable pullback, falling 16.1% in the past month and 8.2% in the past week, with technical indicators releasing multiple bearish signals. Futures open interest has decreased nearly 50% from its peak, and reduced trading volume has amplified spot selling pressure; on the 12-hour chart, the 20-day EMA has fallen below the 50-day EMA, while the 50-day EMA on the 4-hour chart is close to crossing below the 200-day EMA, indicating a clear short-term downtrend.
The daily chart forms a descending triangle pattern, with the current price around 0.39 USD, support levels found at 0.38 and 0.36 USD. If support is lost, it may drop to 0.23 USD, representing about a 40% downside from the current price. Only by breaking the 0.43 USD resistance can the bearish pattern be reversed and trigger a recovery.
Article Summary: The battle between bulls and bears in mainstream altcoins is intensifying, with XRP and Dogecoin needing to break through key resistance to confirm upward trends, while Chainlink and Stellar need to be wary of technical breakdown risks; investors should closely monitor trading volume and key price levels.


