
XRP may face a decisive breakout! 📈💥 Elliott Wave + symmetrical triangle suggest new highs are imminent?
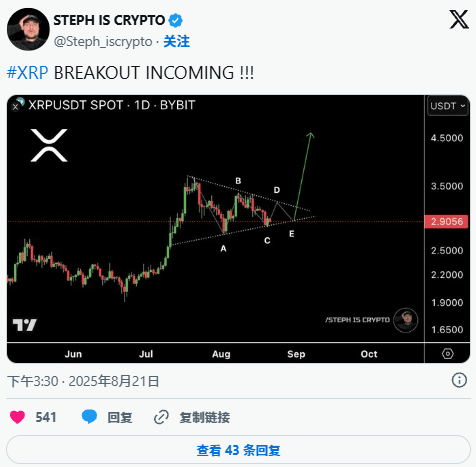
Recently, crypto analyst Steph Is Crypto (@Steph_iscrypto) shared a chart of XRP that drew market attention. The chart shows that XRP has formed a clear symmetrical triangle on the daily chart, following a five-wave Elliott wave pattern. This means that once XRP successfully breaks out of the triangle, its upward momentum could significantly increase! 🚀
Chart setup analysis 🧐
According to Steph's analysis, XRP began forming a symmetrical triangle in July after reaching an all-time high. Within this formation:
Highs gradually decline 🛑
Lows gradually rise ⬆️
The volatility range is being continually compressed ⚖️
At the same time, the chart notes that the starting point of wave E is near the peak at the beginning of September, indicating that this sequence is approaching the maturation stage. As the symmetrical triangle gradually converges, XRP's volatility may soon be released.
In simple terms, XRP is accumulating 'energy' and may soon experience a significant move! 💣
What does the prediction mean? 🎯
The green arrow on the chart points from the tip of the triangle to above the price scale, ultimately aiming near $4.5. Although no specific timeframe is provided, the direction and position of the arrow clearly indicate:
Analysts expect XRP to experience a decisive rise after the consolidation ends.
Trading within the current range is merely preparatory; the real opportunity lies after the breakout.
This also means that if XRP continues to close above the triangle with increased volume, this target is expected to be achieved.
Why is this pattern important?
The symmetrical triangle is not only a technical formation but also reflects the psychology of market participants:
Buyers and sellers take turns controlling the market.
Highs are gradually decreasing, and lows are gradually increasing, forming price compression.
The long-term upward trend provides solid support.
If XRP can firmly break through and close above the dashed line, this will validate the market's upward momentum. Conversely, if it falls below the support level, a short-term consolidation may be extended, potentially leading to a price drop 📉.
The next movement of XRP
From the chart analysis, two practical conclusions can be drawn:
XRP is entering the final wave of the Elliott Wave, with the structure maturing and the possibility of a breakout increasing.
The real opportunity comes after the breakout, not while trading within the range.
Currently, XRP is trading at about $2.83, showing a bearish trend similar to the overall market ⚖️. However, if XRP can follow the path described by Steph, this downturn should only be a temporary adjustment, after which it will reach new highs.

Key points for investors to pay attention to ✅
Support level: Pay attention to the support at the bottom of the triangle; a break below may extend the consolidation.
Volume: A breakout accompanied by increased volume is a key confirmation signal.
Closing price: A daily closing price above the triangle will validate the upward momentum.
Elliott Wave: After the completion of the five-wave sequence, the last wave up may be the most explosive.
Overall, this formation and wave pattern provide XRP with a clear short-term strategy guidance, which is to wait for a breakout confirmation rather than repeatedly trading within the range.
Summary ✨
XRP's daily chart forms a symmetrical triangle + five-wave Elliott Wave, indicating a potential short-term breakout.
The current price is consolidating around $2.83, and the downtrend may be the final adjustment.
Once it breaks above the triangle and closes above, the target may surge towards $4.5.
Focusing on support levels, volume, and closing prices is key to assessing the validity of the breakout.
