
Written by: White55, Mars Finance
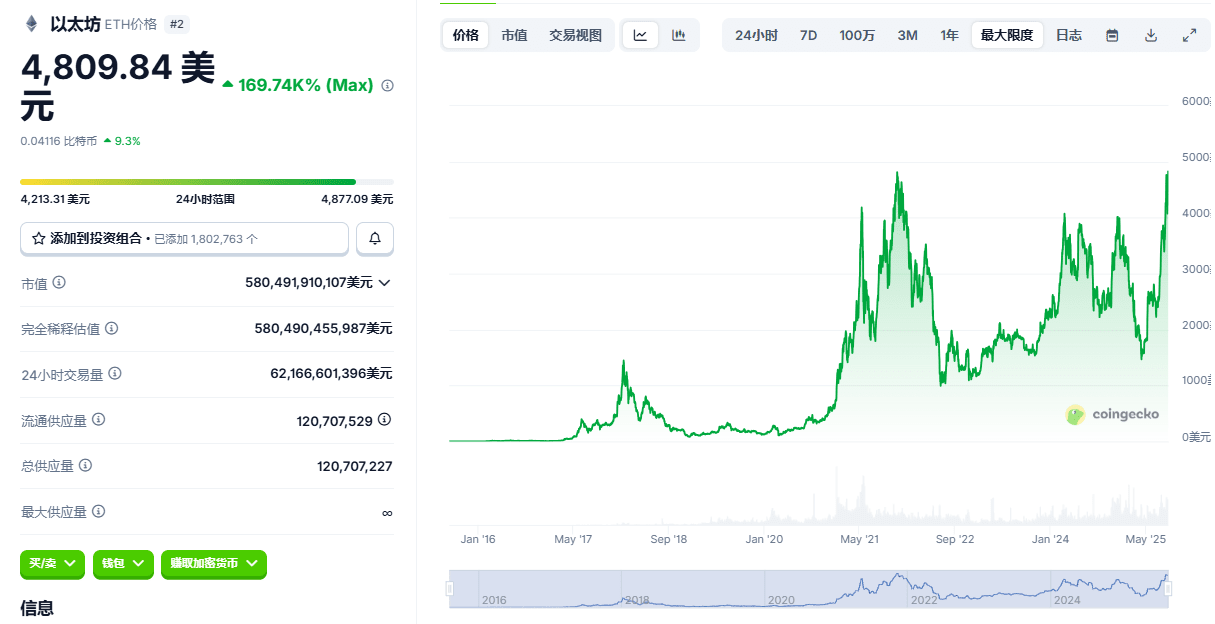
Ethereum (ETH) achieved a historic breakthrough on August 23, 2025, first breaking the $4,800 mark on the Binance trading platform, reaching a high of $4,887, refreshing the previous high record set in November 2021.
This milestone event marks that Ethereum has accumulated a rise of over 250% since the low of $1,385 in April. The core driving forces behind its price surge stem from the Fed's shift to a dovish monetary policy, the continuous influx of institutional capital through spot ETFs, and the strategic large-scale accumulation of ETH by corporate treasuries, forming a triple resonance effect.
Federal Reserve Chairman Powell's interest rate cut signal at the Jackson Hole seminar has become a key catalyst. He clearly stated that the current restrictive policy stance needs to be adjusted based on economic risks and emphasized that the stability of the unemployment rate provides space for policy adjustments, raising market expectations of a 25 basis point rate cut in September to 89%. The prospect of liquidity easing has directly boosted the demand for risk assets like Ethereum.
I. Shift in Monetary Policy and Reconstruction of Market Liquidity
Powell stated Friday at the Jackson Hole seminar: 'The stability of the unemployment rate and other labor market indicators allows us to act cautiously when considering a change in policy stance.' He added:
"Nevertheless, since the policy remains restrictive, the fundamental outlook and the changing risk balance may require us to adjust our policy stance."
Powell's dovish remarks ended the market volatility triggered by the hawkish statements of the Cleveland Fed chair. His discussion of the 'necessity for policy adjustment' was interpreted as a clear signal that the Fed is about to enter a rate-cutting channel.
Data from the Chicago Mercantile Exchange shows that expectations for a rate cut have rapidly rebounded from 73% 72 hours ago to 89%, prompting capital to accelerate its inflow into the high-growth potential cryptocurrency sector.
It is noteworthy that Ethereum has shown stronger price elasticity than Bitcoin during this round of liquidity expectation reconstruction—ETH has risen 54% in the past 30 days, far exceeding BTC's 10% increase, reflecting a significant increase in preference for high-volatility assets amid a shift in macro policy.
Standard Chartered noted in its latest report that a Fed rate cut will reverse the competitiveness of ETH staking annualized yields (3%-5%) against traditional U.S. Treasury yields, especially in an environment of declining Treasury yield expectations, making ETH's yield property more attractive to institutional capital seeking excess returns.
II. Institutional Capital Channels: The Capital Siphon Effect of Spot ETFs
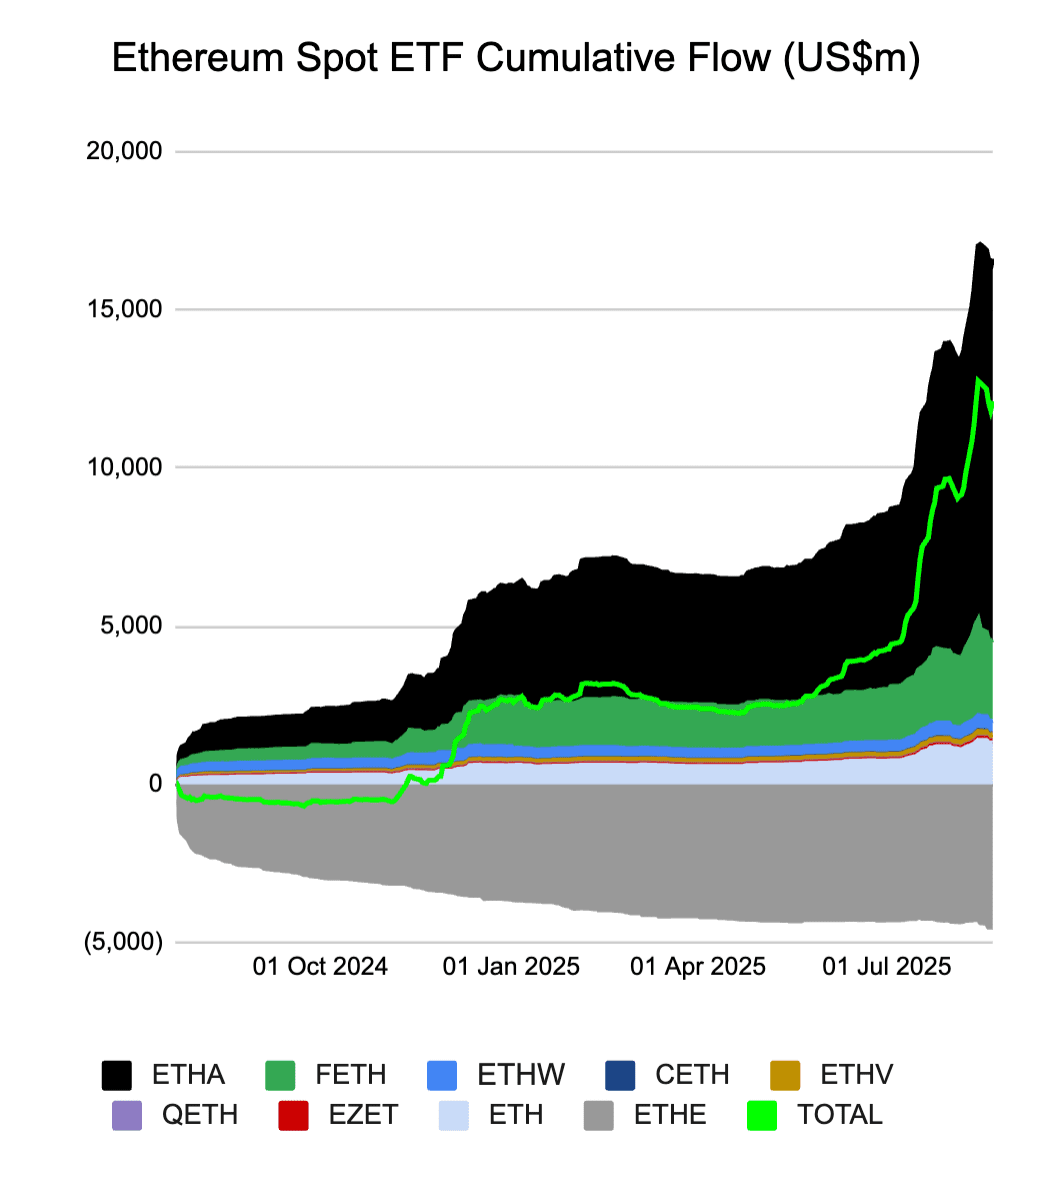
Ethereum ETF net flow. Source: Farside Investors
Ethereum spot ETFs have become the main channel for traditional capital to enter the cryptocurrency market, with capital inflow showing explosive growth in August.
According to Farside Investors data, the net inflow on August 21 reached $287.6 million, ending a previous four-day outflow trend; as of August 23, the total assets under management of U.S. Ethereum spot ETFs exceeded $12.12 billion, an increase of $2.96 billion from last month.
More structurally significant is that two giants, BlackRock (ETHA) and Fidelity (FETH), occupy two-thirds of the market share, with BlackRock's ETF having once set a record for daily inflows at $640 million, highlighting the high concentration trend of institutional capital.
The differentiation in capital flows is also significant: during the same period, Bitcoin ETFs experienced a net outflow of $502 million, while Ethereum ETFs have attracted more corporate investment in the past six weeks than the total of the previous 12 months. This contrast confirms the 'structural advantage' of ETH emphasized by JPMorgan analysts—if the SEC approves ETF staking functionality, Ethereum ETFs will upgrade to 'interest-bearing assets,' forming differentiated competitiveness compared to Bitcoin ETFs.
III. Corporate Treasury Strategies: Institutional Breakthrough in ETH Asset Reserves
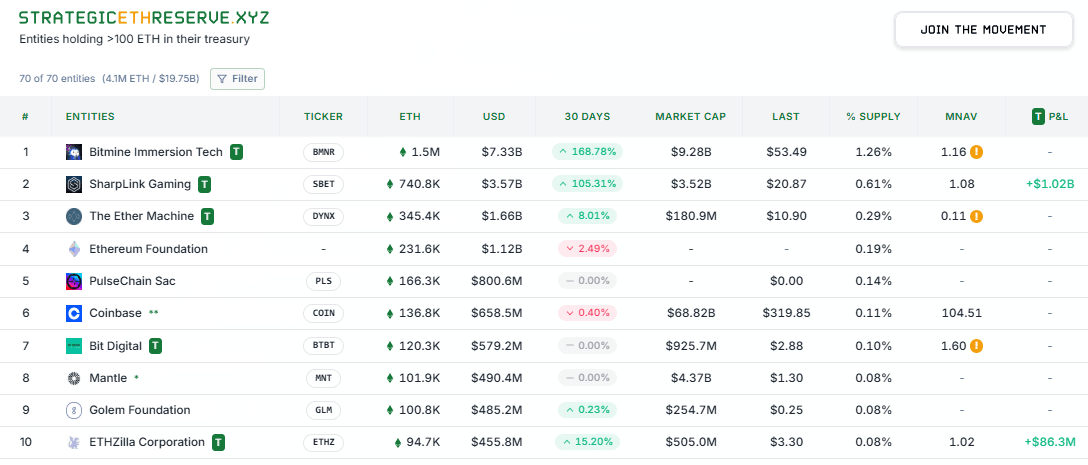
The trend of publicly traded companies incorporating Ethereum into their balance sheets has evolved from individual cases to a systemic wave. Data from StrategicETHReserve.xyz shows that as of August 23, the total value of corporate ETH holdings has surged to $31 billion, an increase of $2 billion from last month.
The strategic layout of core participants shows three characteristics:
Scale Concentration: Nasdaq-listed company BitMine Immersion Technologies holds 1.523 million ETH (approximately $7.3 billion) and plans to raise $20 billion to continue increasing its holdings, aiming to control 5% of the global ETH circulation; SharpLink Gaming ranks second with 740,000 ETH holdings, of which 99.7% of assets are deployed in staking protocols.
Diversification of Yield Strategies: Companies not only passively hold ETH but also generate additional returns by running validation nodes, participating in liquidity staking, and DeFi strategies. For example, Cosmos Health builds staking infrastructure through BitGo Trust, converting ETH into 'programmable cash flow assets' with an annualized return of 3%-4%.
Regulatory Synergy: The (GENIUS Act) provides a legal framework for stablecoin issuance, and Ethereum, as the main issuance network for mainstream stablecoins like USDT and USDC, directly benefits from regulatory clarity. Bitwise Chief Investment Officer Matt Hougan pointed out that corporate ETH holdings have reached 32 times the new supply on the network during the same period, forming a 'demand shock' effect.
IV. Market Structure Evolution: Rotation from BTC Dominance to Altcoin Season
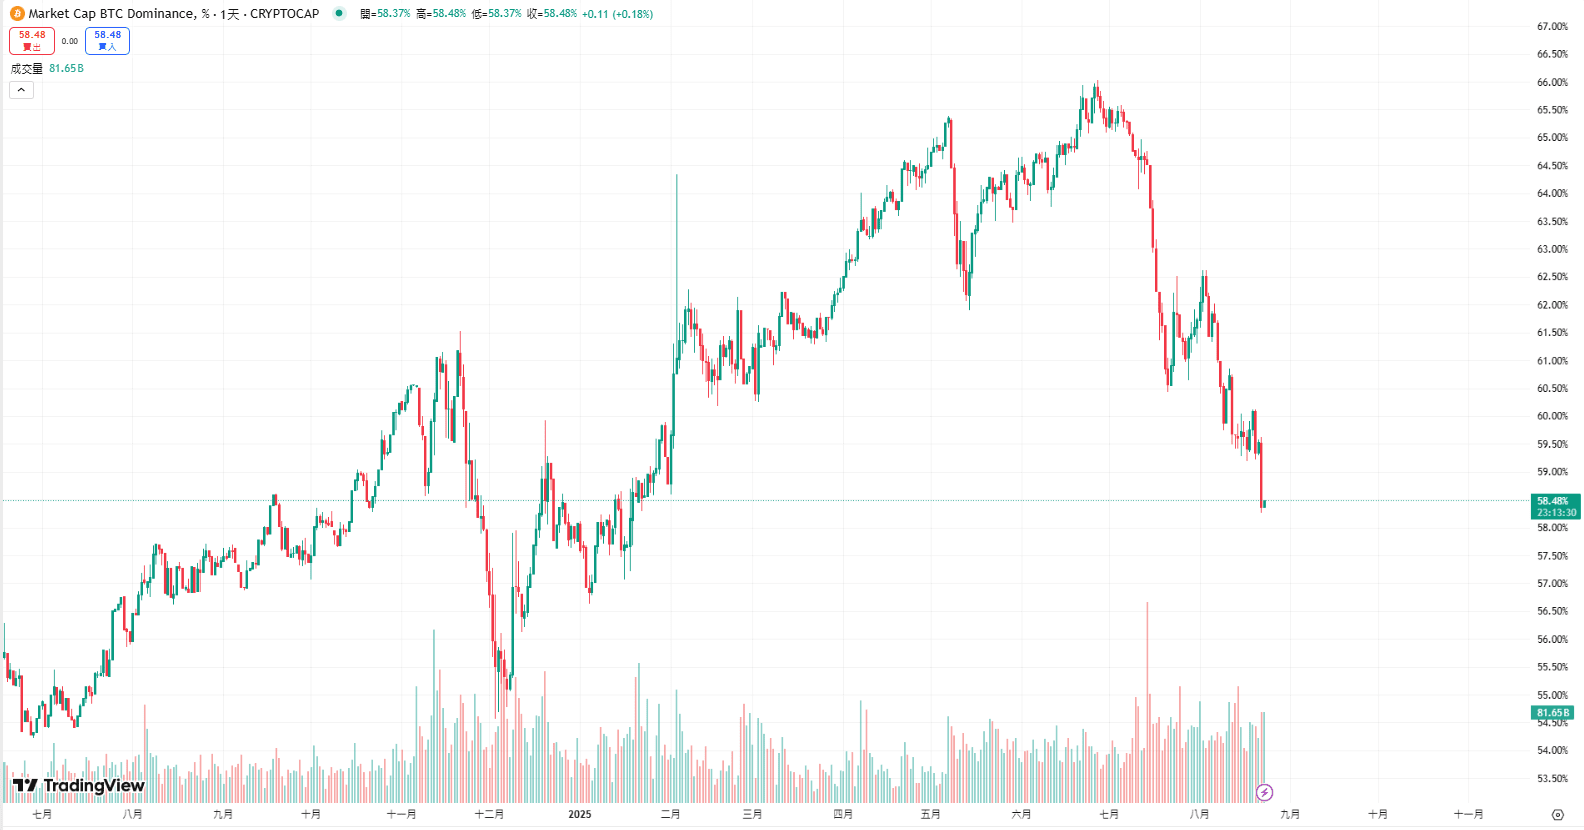
As Ethereum hits a new high, significant signs of internal capital rotation in the cryptocurrency market are evident.
Bitcoin's market cap share reached 58% for the first time in four months, significantly down from the year's high of 66%, reflecting a trend of capital moving towards high beta assets.
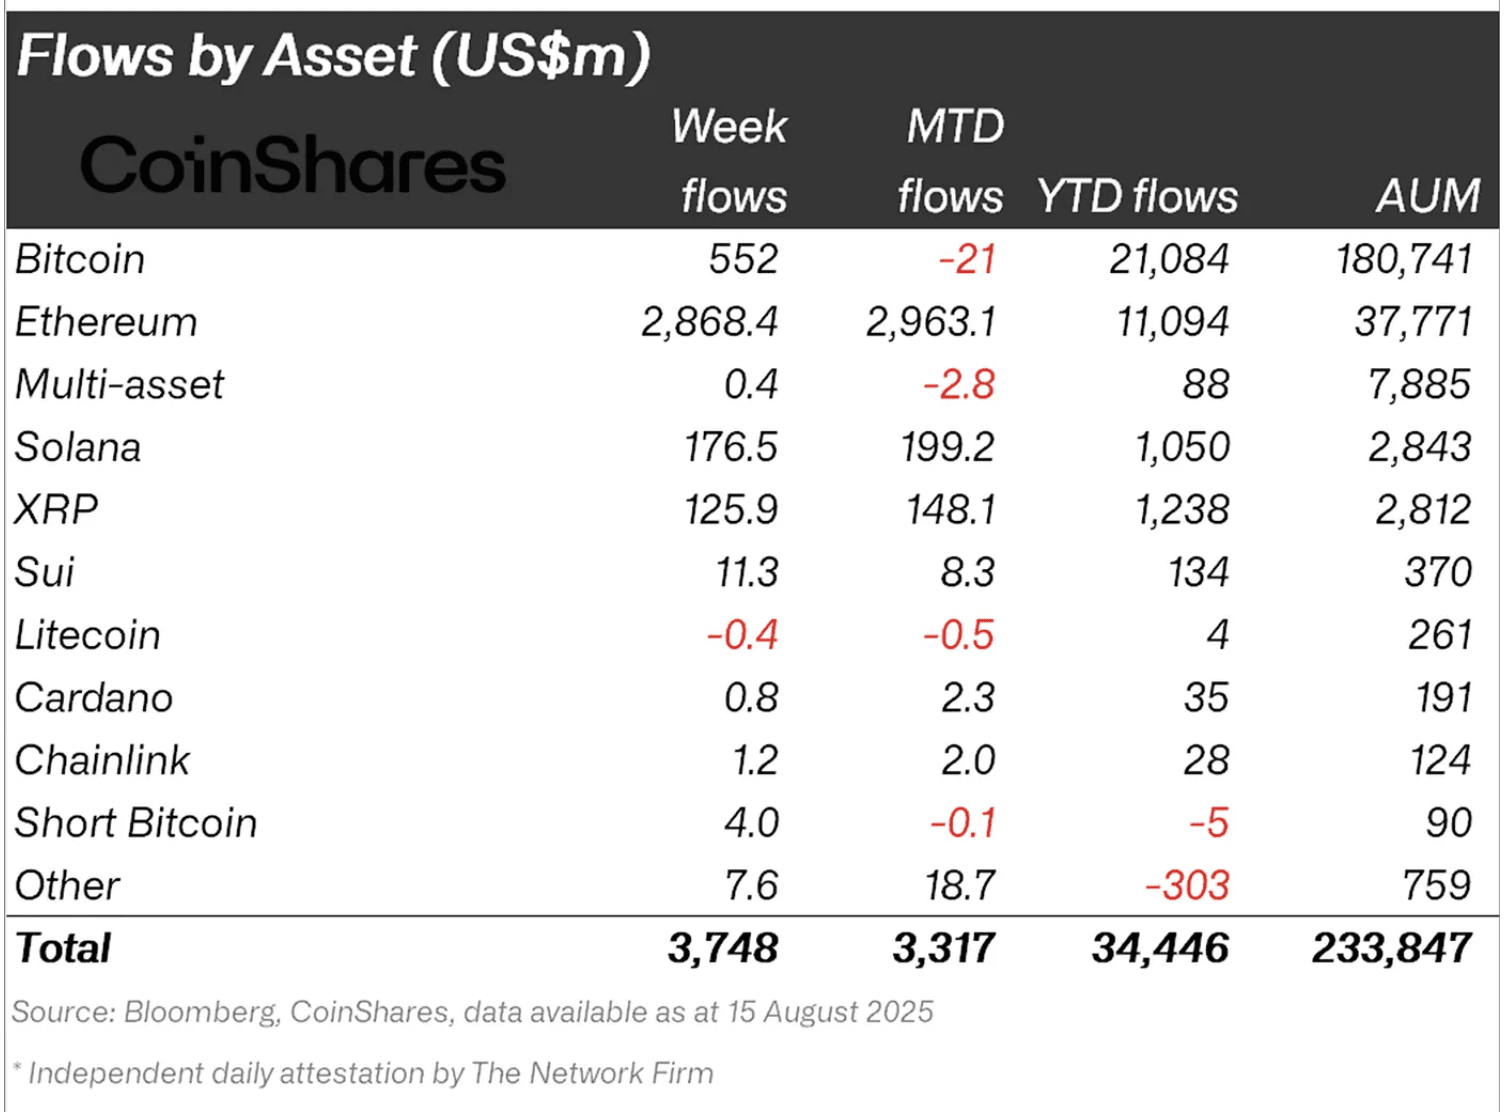 Net flow of cryptocurrency funds. Source: CoinShares
CoinShares data shows that as of the week ending August 15, net inflows into Ethereum investment products reached $2.86 billion, far exceeding Bitcoin products' $552 million; so far this month, ETH fund holdings have increased by $2.96 billion, while BTC products have seen a net outflow of $21 million.
This rotation aligns with historical cyclical patterns: when Bitcoin breaks key resistance levels (this round BTC stabilized at $120,000), capital often shifts to Ethereum seeking higher returns, ultimately triggering altcoin season.
Currently, the ETH/BTC exchange rate has risen above 0.41, an increase of nearly 50% from last month, but is still 45% lower than the 2021 peak, indicating potential for subsequent catch-up. On-chain analysts have observed that the balance of ETH on exchanges has fallen to 14.9 million, the lowest since July 2016, creating a supply-demand imbalance due to circulation tightening and institutional lock-up (ETF + staking), providing fundamental support for price increases.
V. Technical Analysis and Market Sentiment: Target Range After Breaking Previous Highs
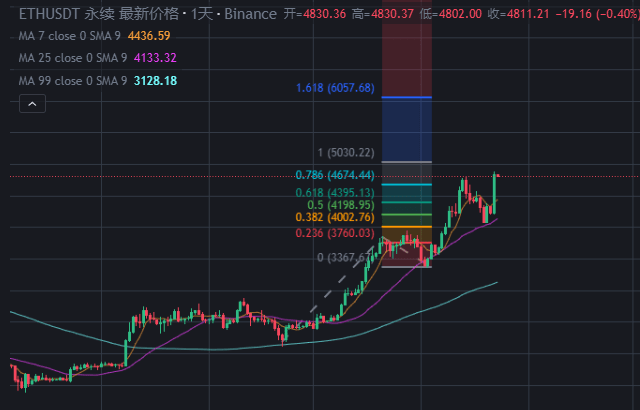
The technical pattern confirms Ethereum's strong breakout. Ethereum has consistently stayed above the MA 25-day moving average, with the 4-hour line forming a descending wedge breaking upward, and the daily level completing a bull flag pattern, with the $4,300 key resistance turning into a support level. The Relative Strength Index (RSI) remains high at 66, and the MACD histogram has turned positive and produced a golden cross on the monthly line, all of which are technical signals of the end of a four-year downtrend.
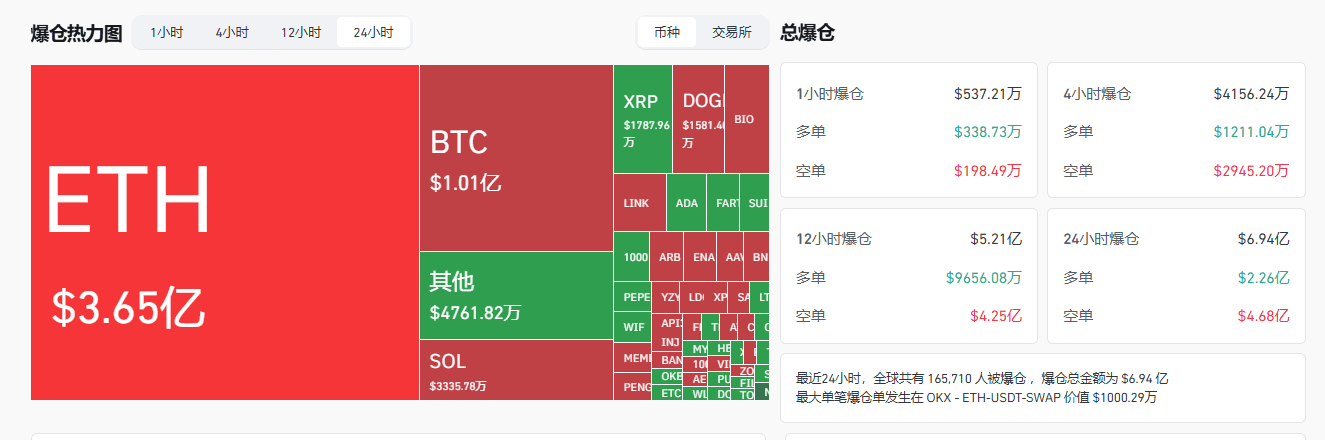
The derivatives market reacted strongly: Coinglass data shows that within 24 hours of ETH breaking its historical high, the total liquidation across the network reached $690 million, with short liquidations accounting for 65% ($460 million), reflecting a discrepancy in market expectations regarding the sustainability of the breakout.
Analyst target ranges show layered characteristics:
Short-term Target: After breaking $4,800, the $4,900-$5,000 range becomes the first resistance zone, with a weekly close above $4,100 confirming the continuation of the trend.
Mid-term Target: Technical models indicate that around $6,100 is a reasonable target, with the 1.618 Fibonacci extension level of the 2,200-$4,100 upward wave pointing to $6,100.
Long-term Forecast: BitMine Board Chairman Thomas Lee sees the ETH/BTC exchange rate model reaching $16,000; Standard Chartered has raised its year-end target to $7,500, predicting $25,000 by 2028; Placeholder Ventures partner Chris Burniske has proposed an optimistic scenario of $13,000.
Ethereum's historic breakthrough not only reflects a victory at the price level but also reveals its transformation from a 'speculative token' to an asset class of 'global settlement layer.' As the staking economy establishes an on-chain rate anchor, ETFs unlock traditional funding channels, and corporate treasuries build practical application scenarios, the triple narrative resonance is reconstructing ETH's value logic. When its $590 billion market cap surpasses Netflix and approaches Visa, Ethereum has proven its inevitability as infrastructure for the digital economy—while Bitcoin may still be 'digital gold,' Ethereum is becoming the 'protocol engine of value flow.'


