1. News Analysis
The first chart shows that two newly created wallets withdrew 80,003 SOL (approximately $14.7 million) from Binance in the last 2 hours and all were used for staking. This behavior may indicate that large investors have long-term confidence in the Solana network, locking in assets through staking to earn returns and reduce market circulation, potentially providing support for SOL prices in the short term.
2. Technical Analysis
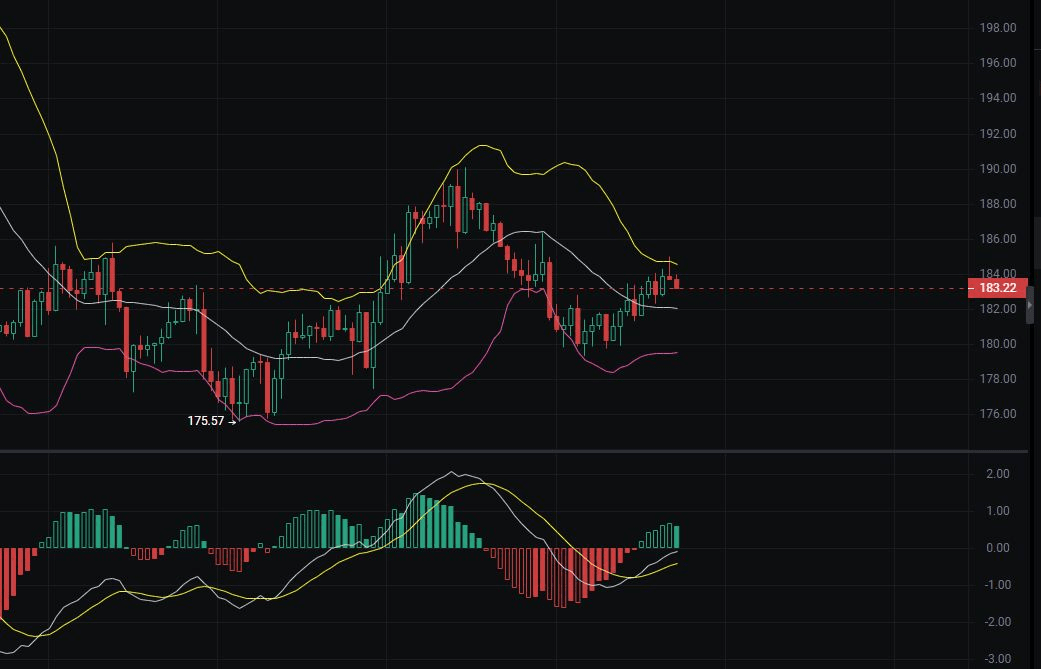
The second chart is the hourly price chart of SOL (current price 183.22), with key signals including:
Moving Average: The yellow line (long-term) is at the top, the white line (mid-term) and purple line (short-term) are below, which may suggest that short-term prices are under pressure, but the long-term trend remains intact. • Oscillator Indicator (similar to MACD): The histogram and multiple curves fluctuate near the zero axis, indicating that the market is in a consolidation state, and we need to observe whether a directional breakout occurs. • Key Resistance and Support: Recent resistance is in the 188-190 range, and support is around 180.
Exclusive Judgment by Fuqi President: Large pledge activities combined with the current price oscillation pattern may reflect that institutions are accumulating assets and waiting for the market direction to become clear. If the price stabilizes above the 180 support level and the oscillator indicator turns positive, a rebound opportunity may arise. It is recommended to pay attention to subsequent changes in trading volume and overall market sentiment.
Want to know detailed levels? Follow my homepage. The Fuqi President's team specializes in serving ambitious maniacs! Follow Fuqi to guide you.


