The Dogecoin to USD exchange rate has fallen below $0.2320, starting a new round of decline. It is currently in a consolidation phase and may further drop towards $0.210.
The price of DOGE continues to decline as it has broken below the $0.2250 support level and is below the 100-hour simple moving average.
A bearish trend line has formed on the hourly chart, with resistance at $0.220. If the price holds above the $0.2080 support, a rebound may occur. The price has further declined as Dogecoin accelerated its drop after breaking below $0.240, similar to the movements of Bitcoin and Ethereum, consecutively losing the $0.2320 and $0.2250 support levels, hitting a low of $0.2078.
The current price has slightly rebounded above the 23.6% Fibonacci retracement level (from the $0.2430 high to the $0.2078 low), but it is still below $0.2250 and the 100-hour moving average. In terms of resistance and support on the upside, initial resistance is at $0.220 (trend line position), with major resistance at $0.2250 (50% Fibonacci retracement level).
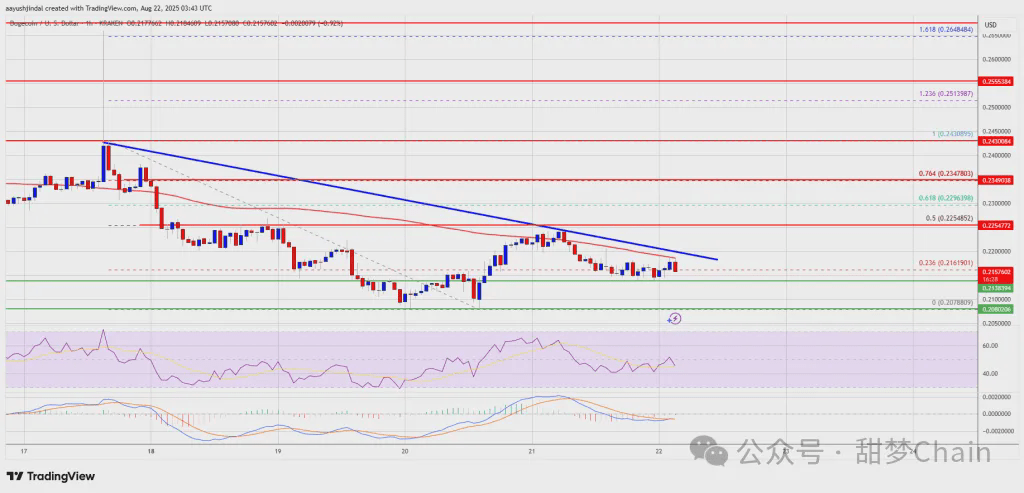
Breaking above $0.2320 could push the price up to $0.2450, or even $0.250 or $0.2550. If it cannot break above $0.2250, the price may continue to fall. Initial support is at $0.2120, with the next key support at $0.2080 and $0.2050. If it breaks below $0.2050, the price may further test $0.20 or even $0.1920.
Technical indicators
Hourly MACD: The MACD for DOGE/USD is gaining momentum in the bearish zone.
Hourly RSI: Below 50, indicating bearish pressure.
Major support levels: $0.2120, $0.2050.
Major resistance levels: $0.2250, $0.2320.


