Ripple's [XRP] price trend continues to reflect its Q4 cycle.
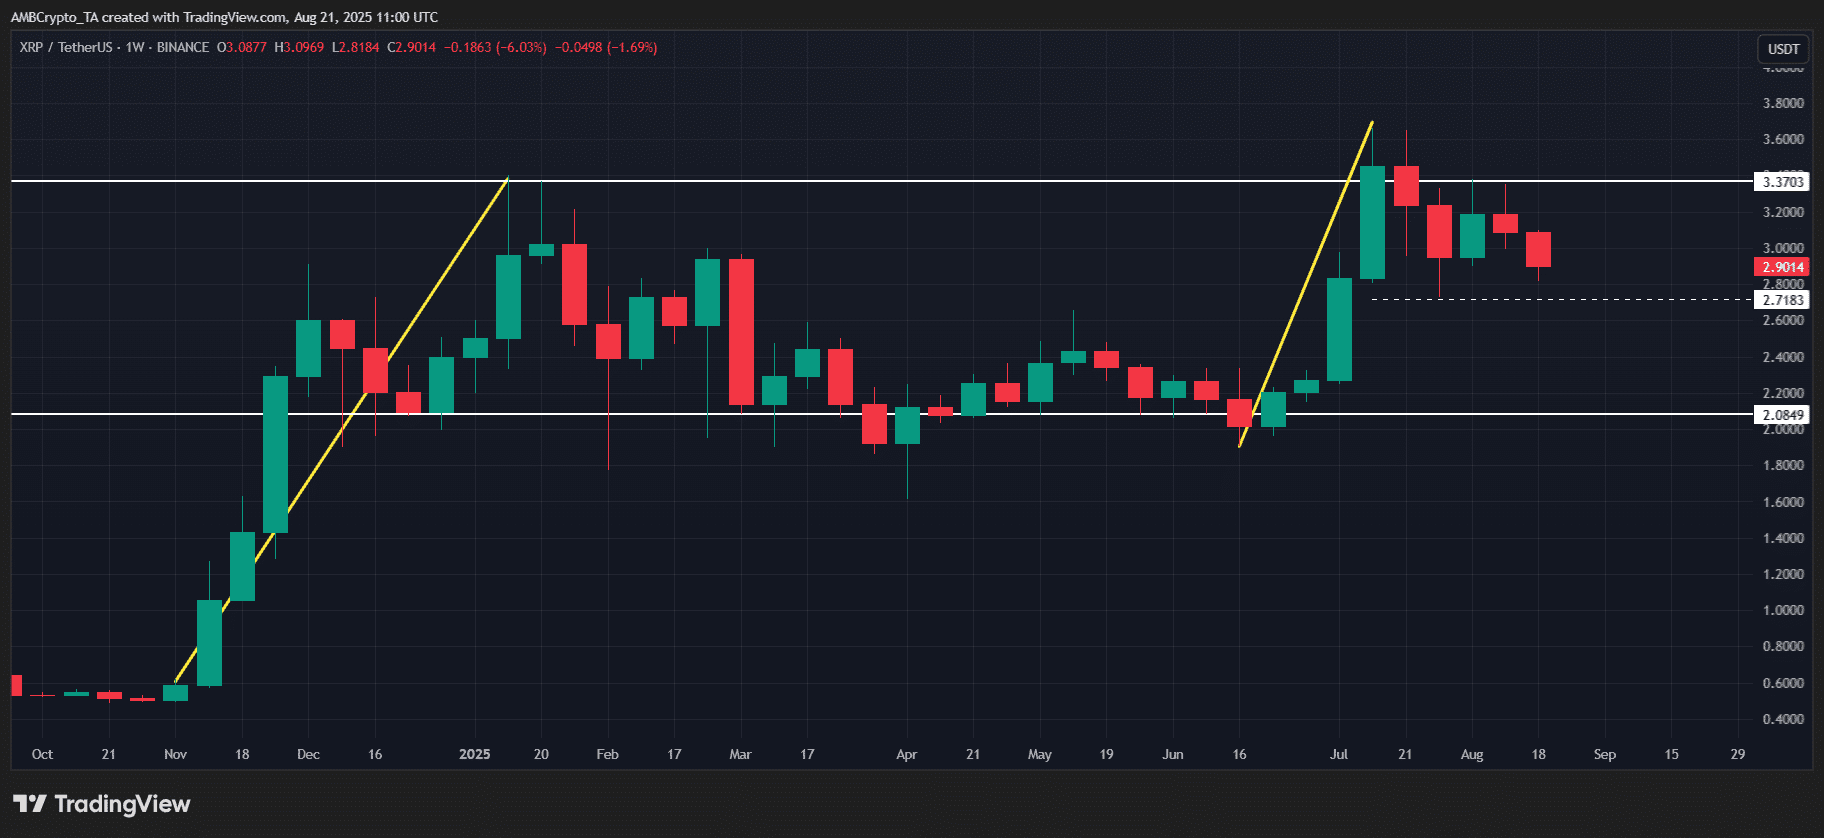
At that time, XRP rose over 290% from a base price of $0.50, hitting near the December high of $2.80, but then quickly turned into a resistance level. This trend dragged XRP's price down, testing the $2 support level at the end of the month.
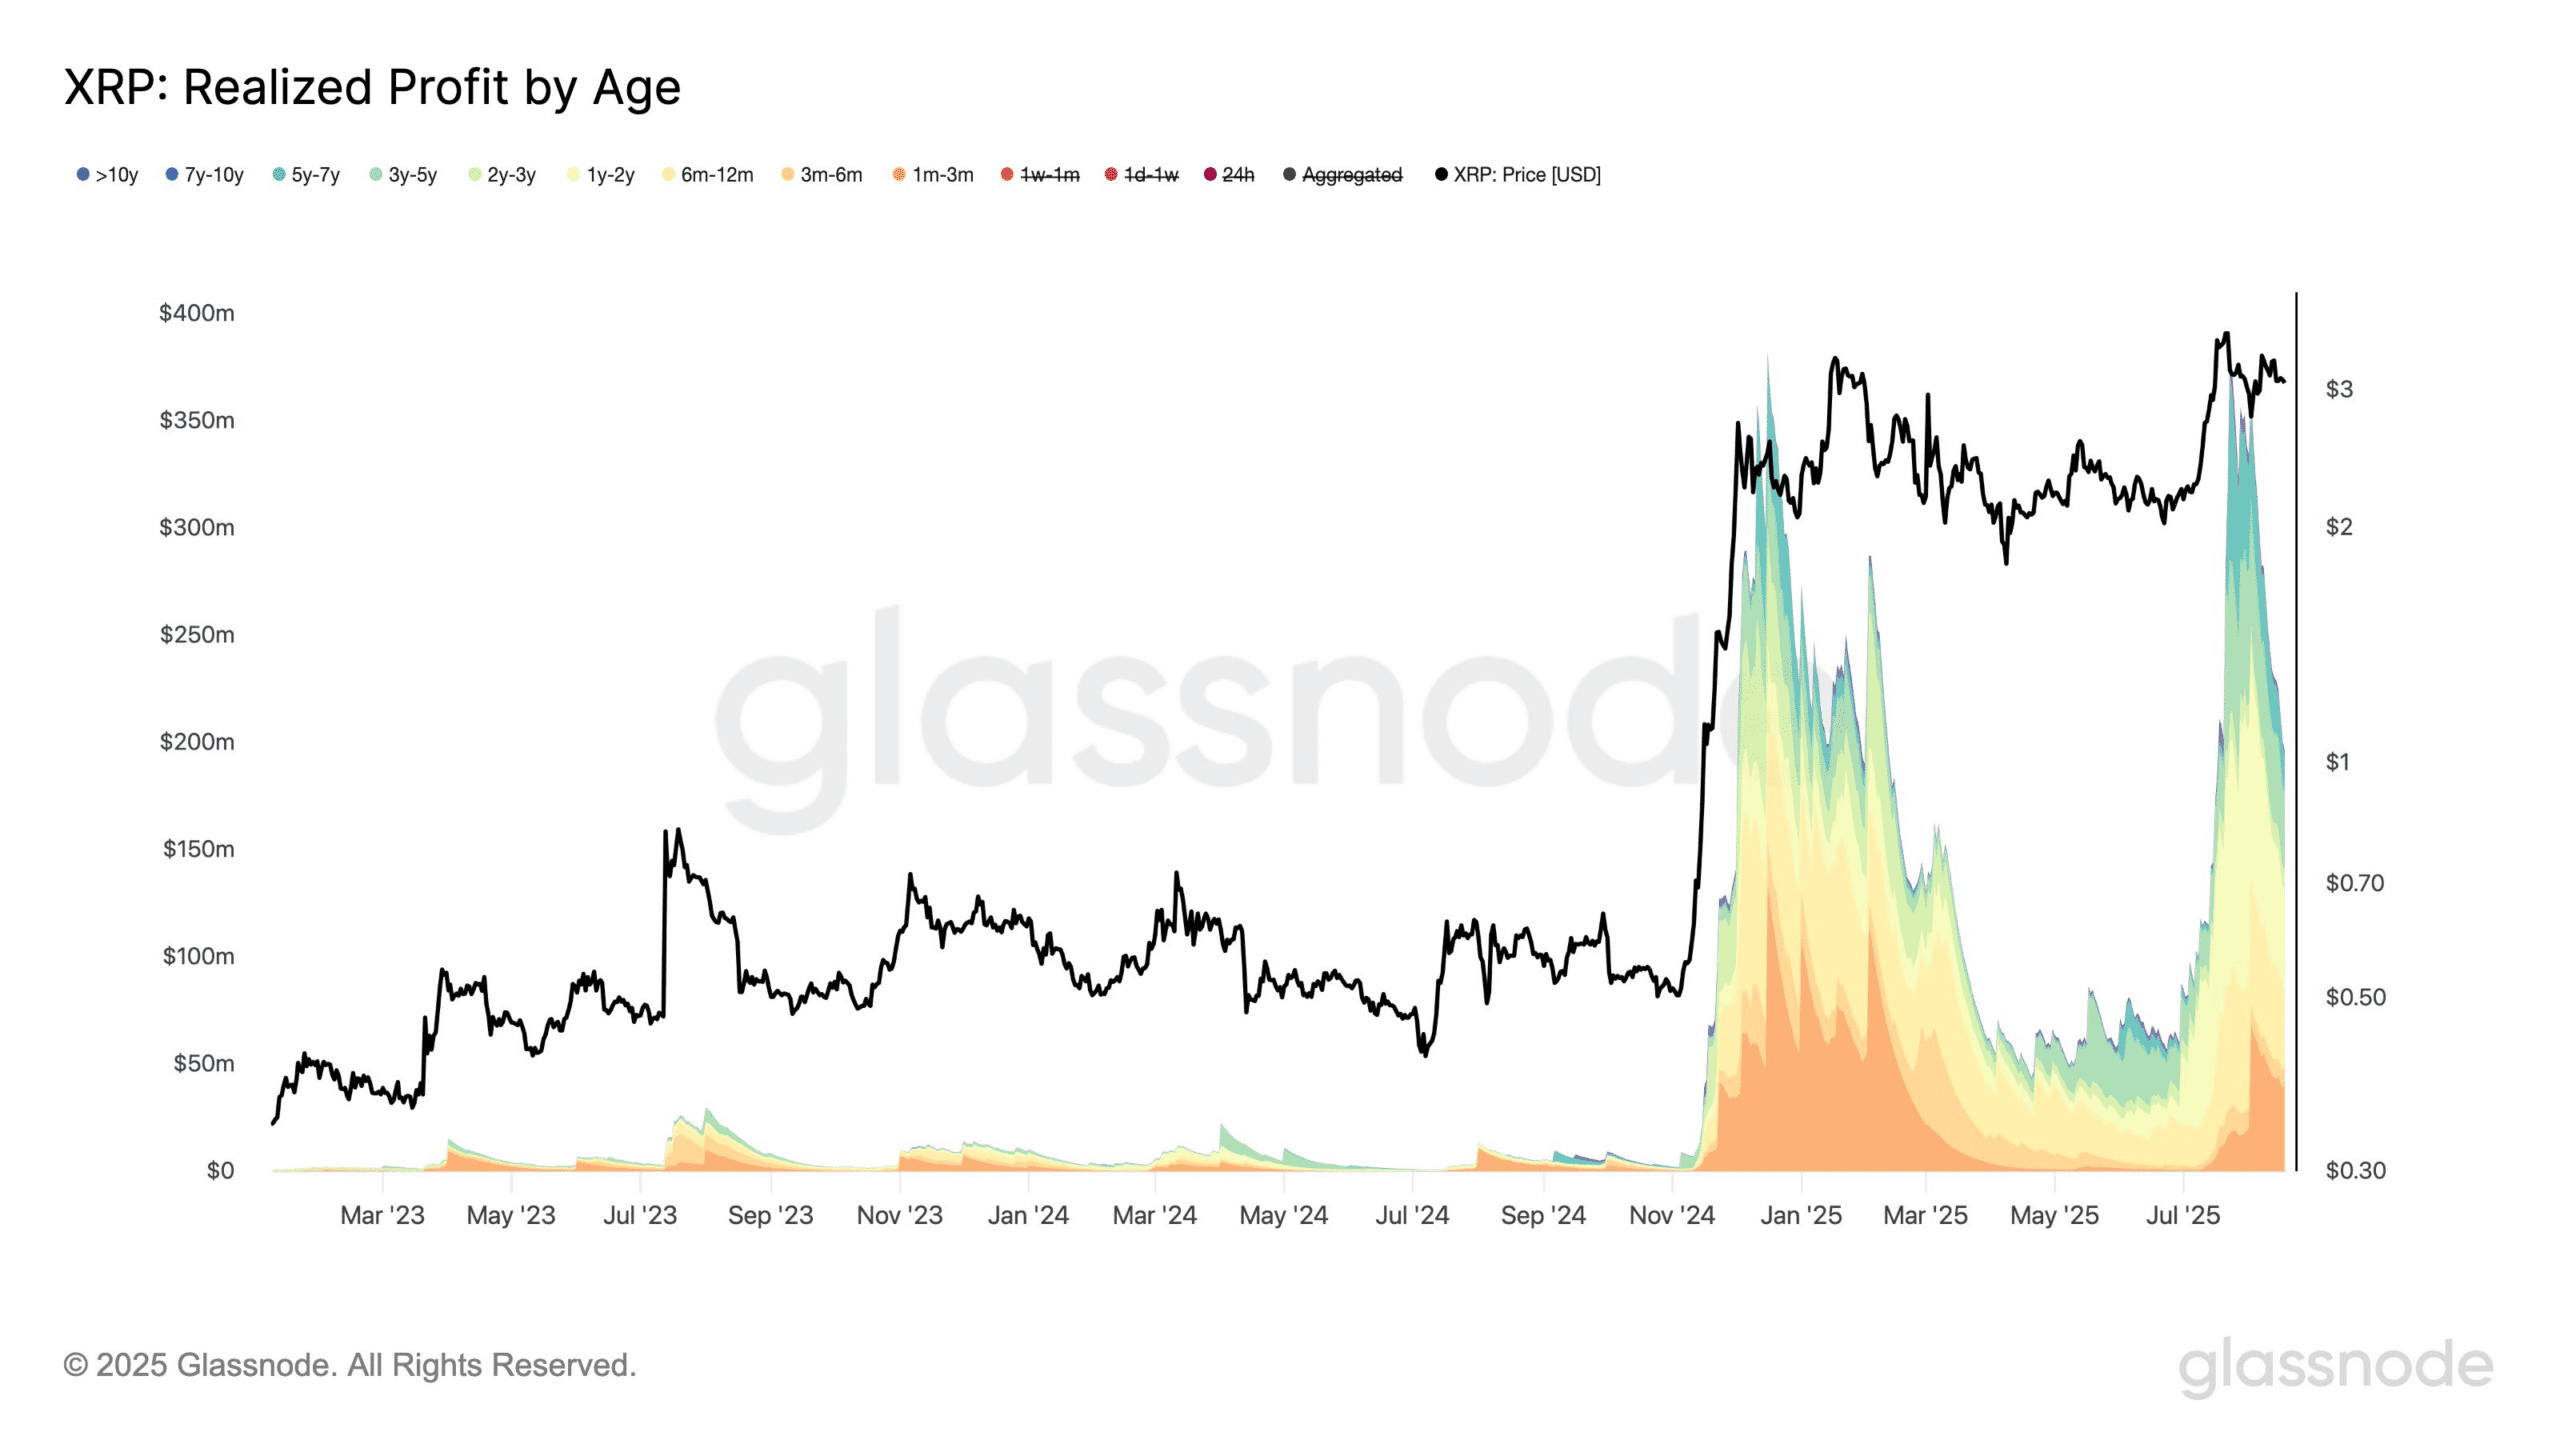
On-chain data shows that this pullback is not random. LTH is taking substantial profits, realizing gains of over $2 billion.
This is a textbook distribution consolidation, laying the groundwork for XRP's next upward move.
 It seems that a similar distribution may be playing out behind the scenes.
As shown in the chart, on July 24, LTH profit-taking surged to $375 million, hitting near the high of $3.55 for XRP. This triggered an intraday drop of 10.33%, marking the longest bearish candle in over three months.
In short, XRP breaking below the $3 support level could repeat the trend seen in early Q1. Last year, the $2 level served as support, triggering a rise of over 60% for XRP, which peaked at $3.35 by mid-January.
The question is: do the bulls lead this setup?
XRP focuses on the support level for the next breakout rebound.
Ripple's consolidation tests the patience of HODLers.
When XRP reaches or nears its cost price, long-term holders (LTH) (more than 1 year) tend to sell. Since peaking in January, this altcoin has experienced five months of sideways consolidation, followed by an increase of over 80% in mid-July, reaching a peak of $3.65.
Against this backdrop, the realized gains of $375 million are not coincidental. Although XRP pulled back to $3, the 6.45% rebound the next day validated the buying barrier and strengthened the support level.
 If this pattern continues, XRP may repeat its Q4 setup.
LTH is gaining strength, and structural support levels are still being maintained. With a shift in risk appetite sentiment, this altcoin may see a repeat of the November rally. This suggests that Ripple could experience an 80% increase, reaching $5.40 by mid-Q1.

