
The price of HBAR has faced difficulties maintaining a consistent uptrend over the last month. After a 10.7% drop in 30 days, the token managed a slight gain of 1.24% in the last 24 hours.
Although its 3-month chart still shows an increase of 16.4%, recent action signals a growing reliance on short-term spikes rather than sustained rallies. Despite the overall weakness, an optimistic pattern has emerged. The 4-hour RSI begins to tell a different story — but whether this is enough to keep the price up remains uncertain.
RSI indicates divergence, but buyers are retreating.
The Relative Strength Index (RSI) is a momentum tool that shows whether buyers or sellers have more control. The RSI on the 4-hour chart of HBAR shows a subtle optimistic divergence.
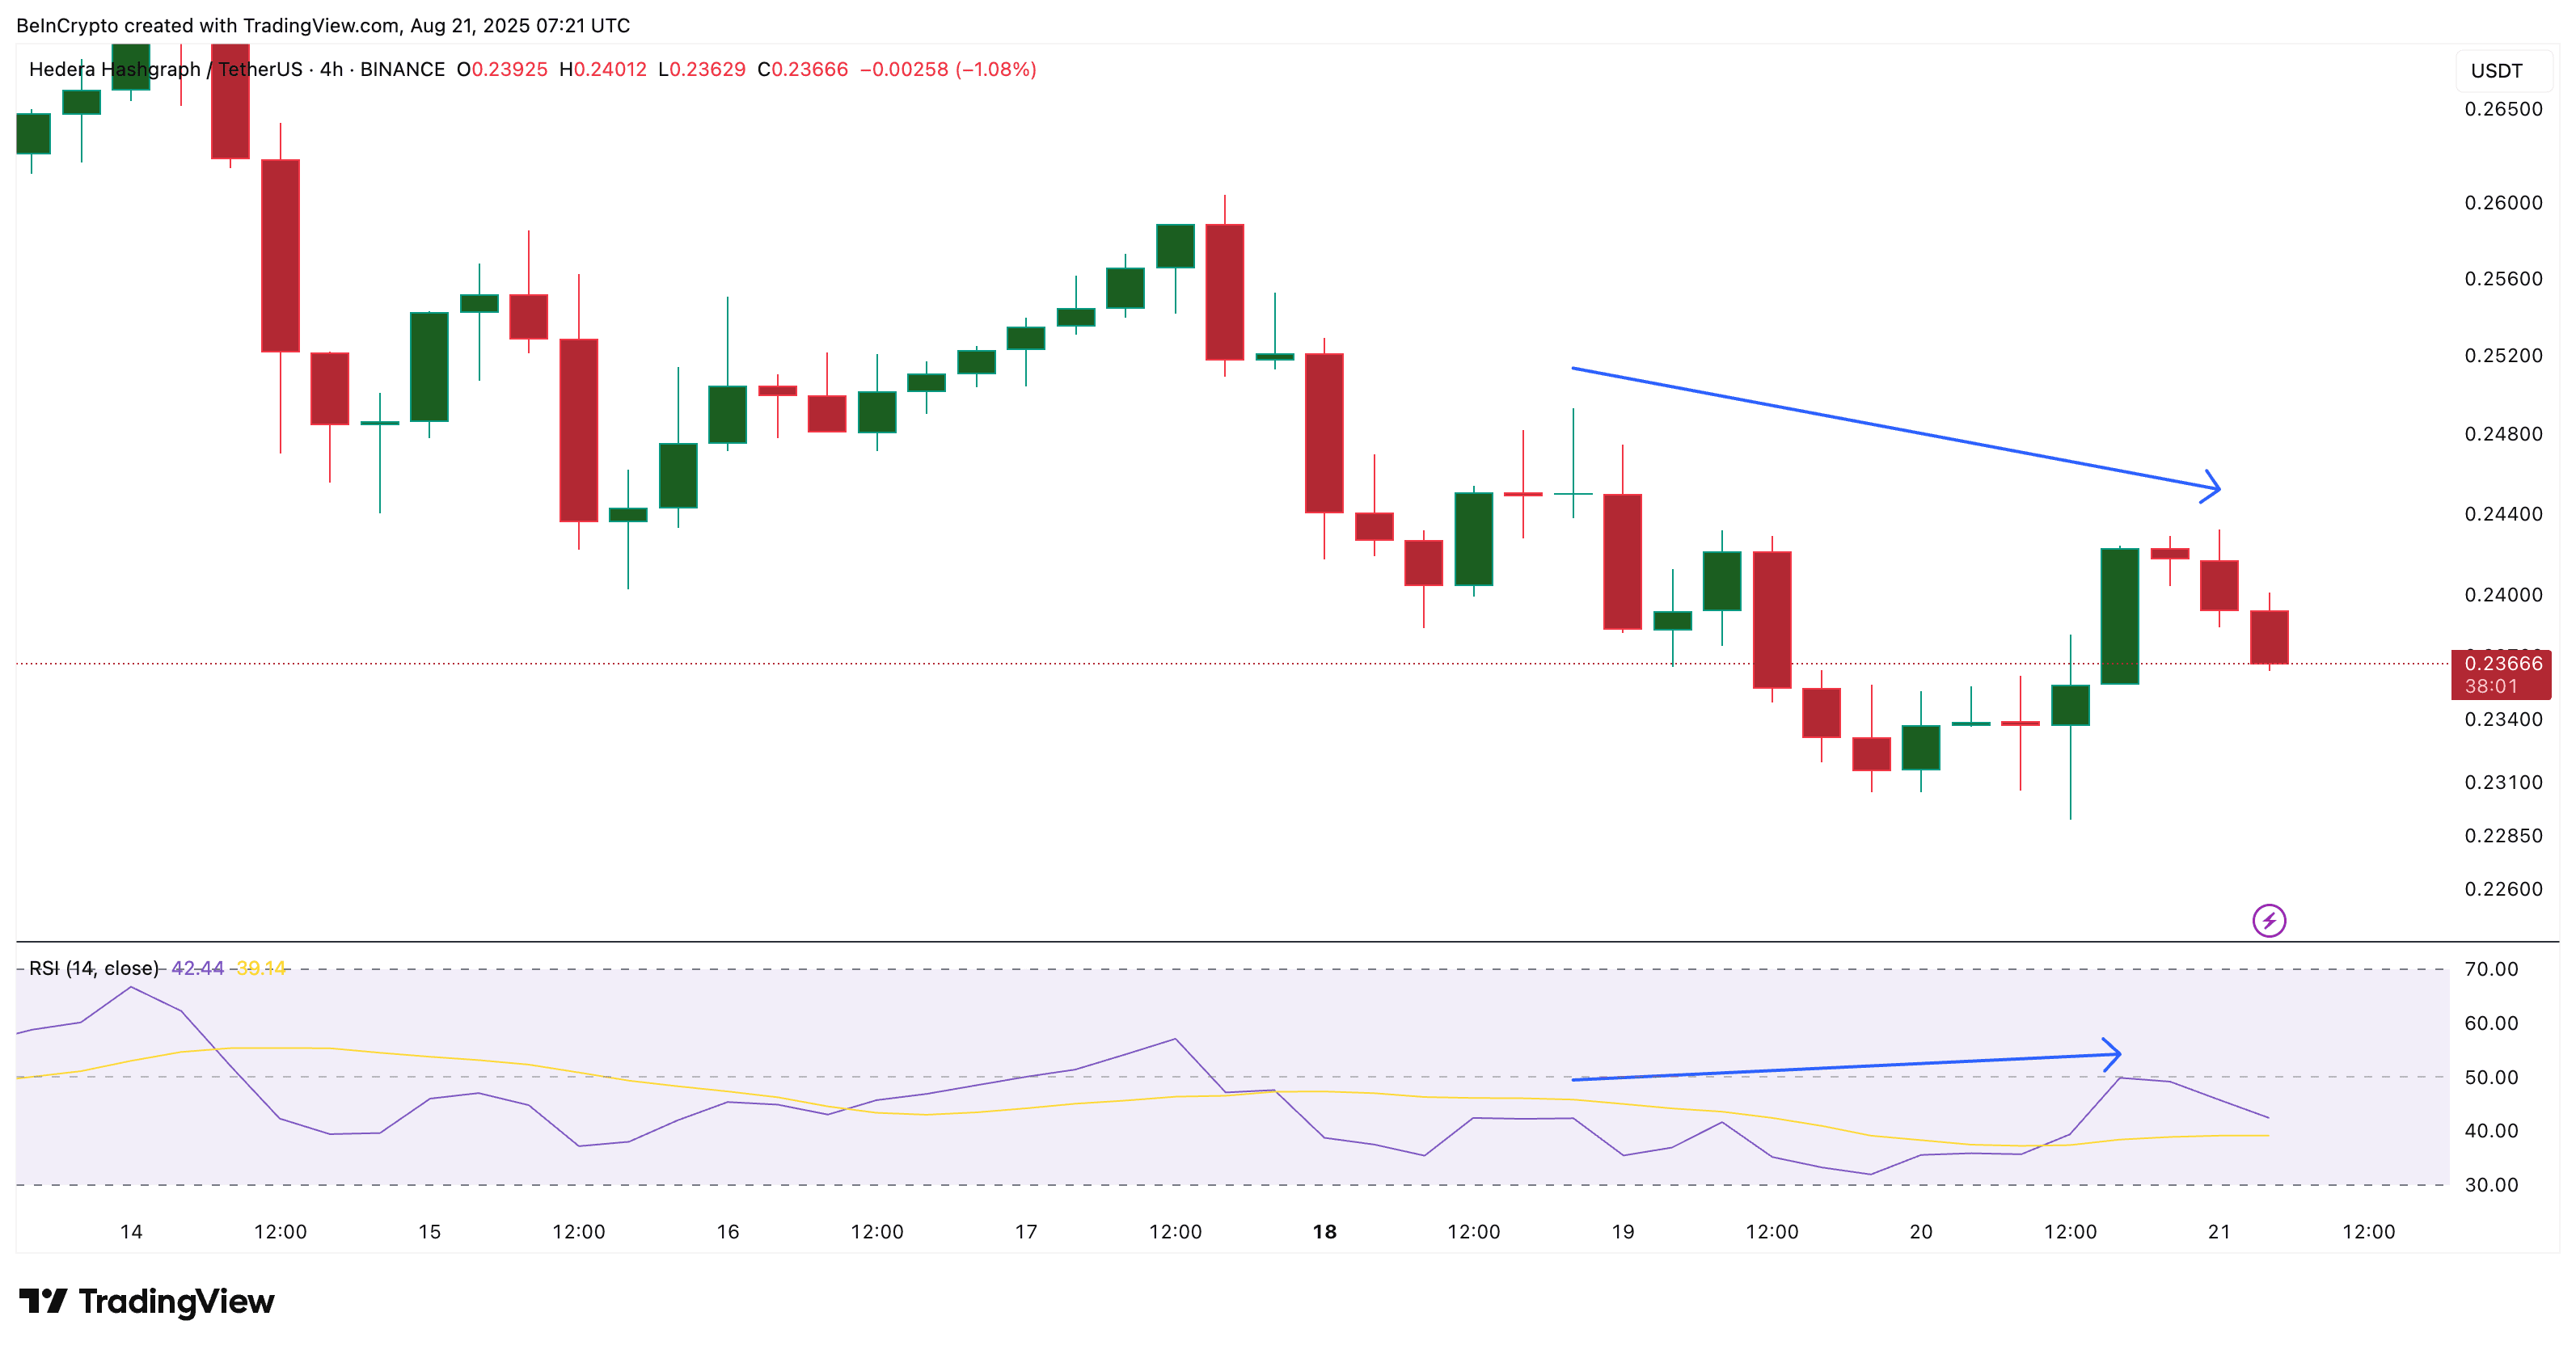 HBAR price and optimistic divergence: TradingView.
Between August 18 and 20, the price of HBAR formed a lower high, but the RSI rose during the same period. This divergence typically indicates that buying momentum is trying to return — at least in the short term — even if the price struggles to break resistance.
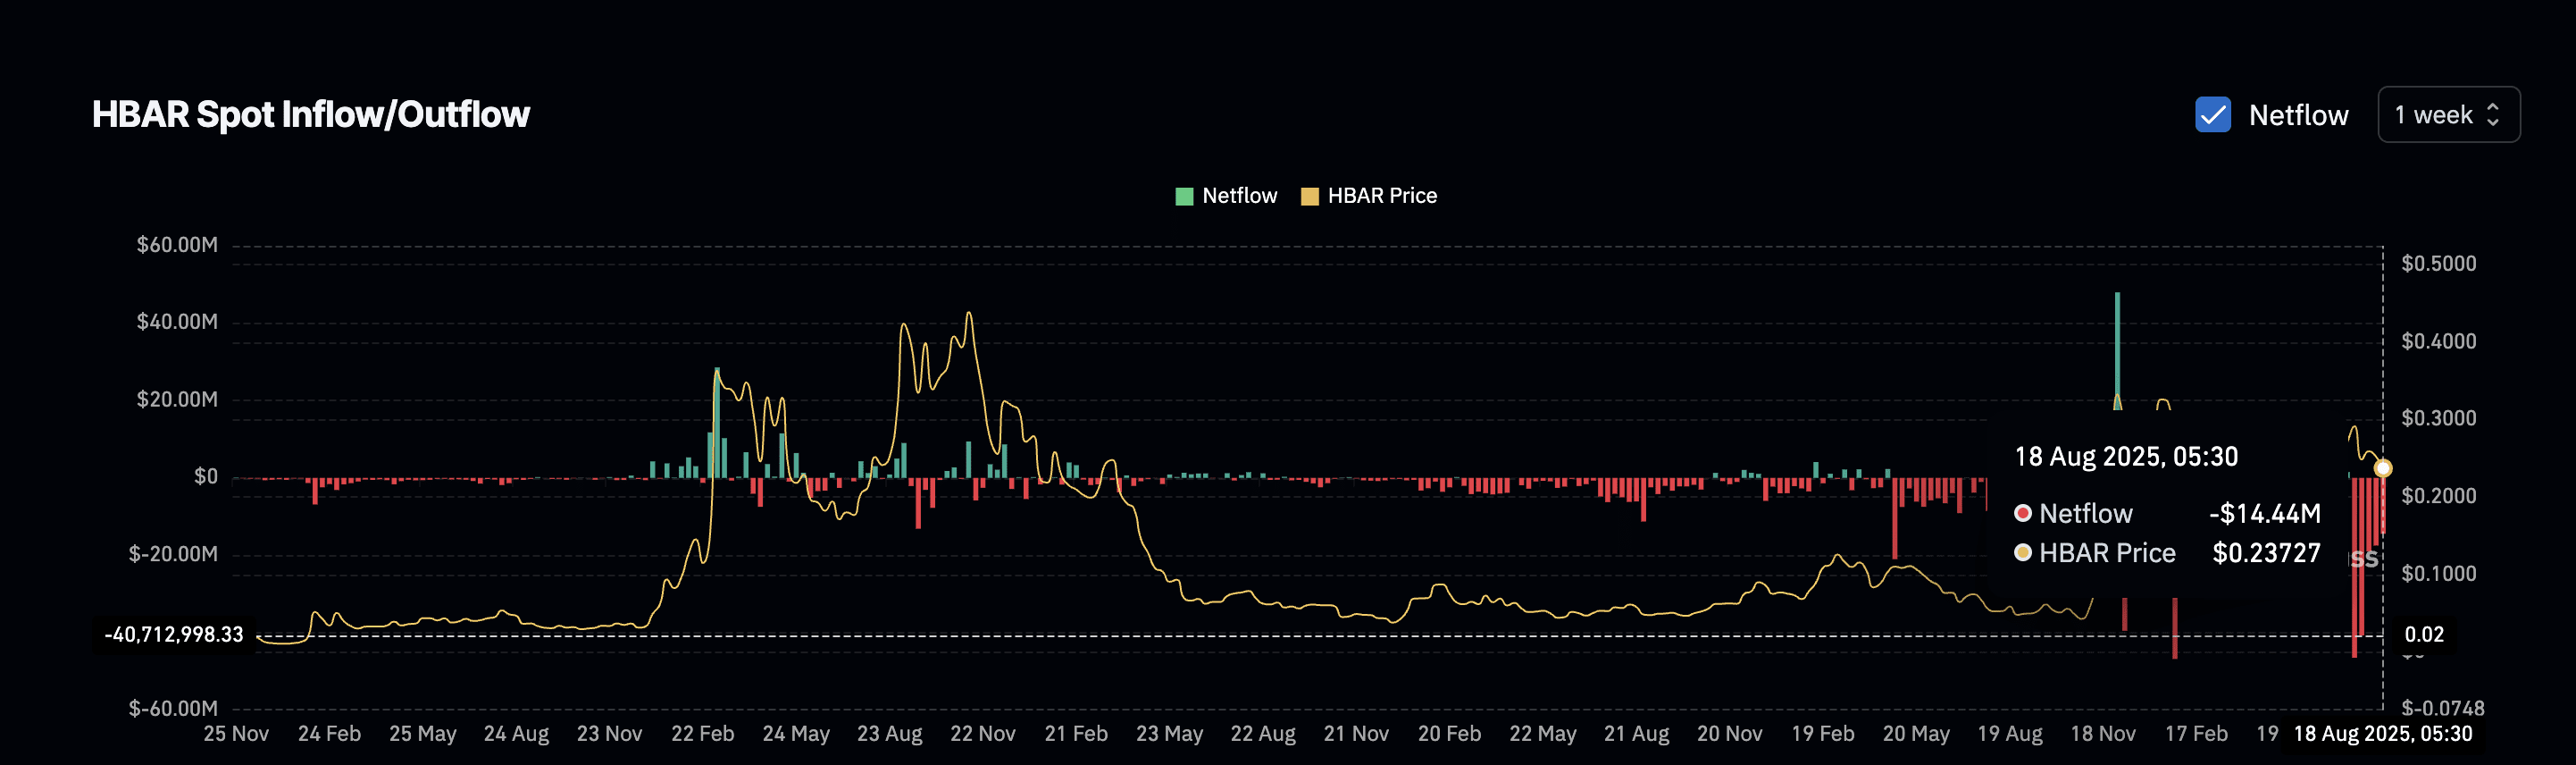 HBAR sellers are gaining control: Coinglass.
However, this short-term moment contrasts with a broader signal of weakness: outflows are decreasing. In the last month, the weekly net outflows of HBAR, which reflect the volume of tokens leaving exchanges, have been steadily declining.
Fewer tokens leaving exchanges suggests that fewer buyers are withdrawing to hold, a typical sign of reduced confidence. The slowing outflows confirm that buyers are still present — but they are retreating.
Thus, while HBAR's RSI suggests a slight recovery, it is likely to be a short-term impulse, not a complete reversal. The divergence may be a single optimistic signal in a space where buying strength is rapidly disappearing.
Price action shows that HBAR is stagnant.
In the 4-hour range, the price of HBAR is hovering near a narrow range between $0.236 and $0.241. The token has struggled to stay above this zone.
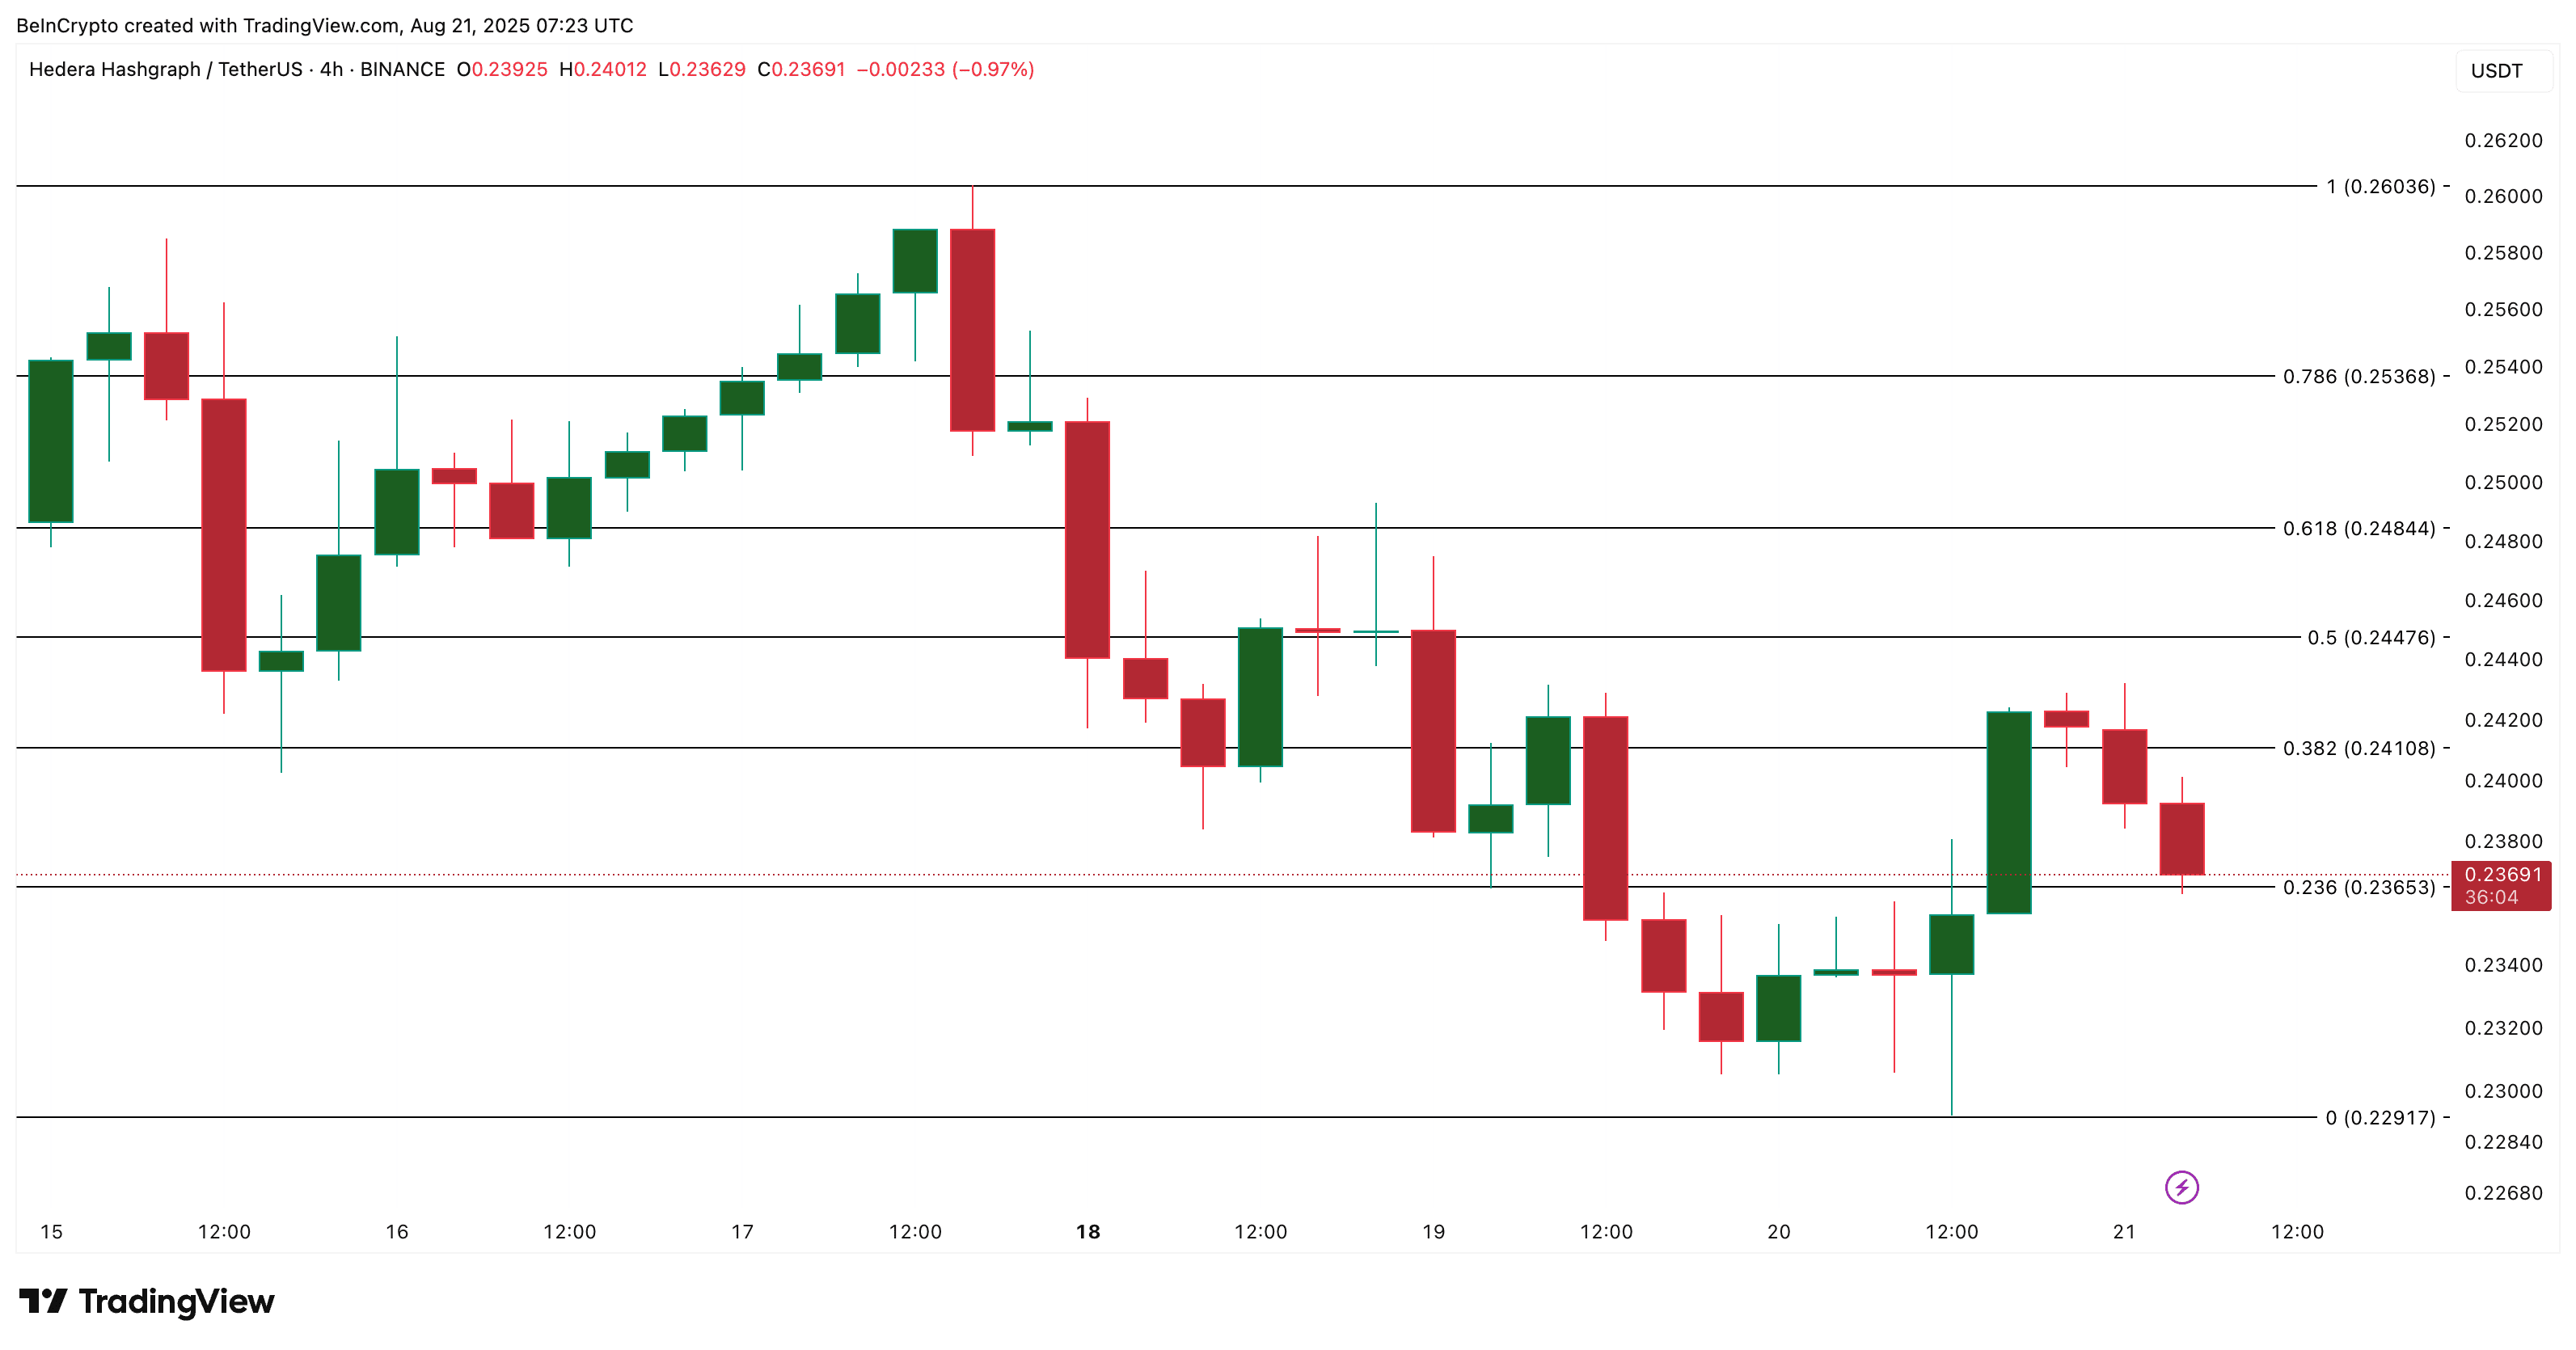 HBAR price analysis: TradingView.
If HBAR can achieve a clear candle close above $0.244, a short spike towards $0.253 or even $0.260 may be triggered, given the lack of strong resistance between those levels. However, if it fails to hold at the $0.236 level, the short-term optimistic pattern may unravel, and sellers are likely to regain full control.
This RSI-supported setup is the only current optimistic hope in the shorter term, and even that comes with caution. Long-term trends remain weak.
The article HBAR loses buying strength, and now? was first seen on BeInCrypto Brazil.
