1. There have been many discussions about price action articles. Is there a feeling of talking on paper? Many friends say that there are thousands of trading systems, and execution power determines the final profit curve of the trading system. So what is a trading system? How to execute a trading system?
I have also said that we must break free from the constraints of indicators. Indicators are consensus, and consensus is often ineffective because the market is counter-intuitive.
However, today we are going to have a real discussion about a trading system that is simple and effective.
This is a simple strategy from the cryptocurrency circle's semi-god. This is a trading method previously revealed, with a surprisingly high win rate. It is also a method I use for small gambling in contracts, with a decent win rate, achieving an astonishing win rate of over 90% in 100 consecutive trades (as long as you are not greedy).
I treasure not being greedy, while you treasure jade. If you give it to me, you will lose your treasure.
Semi-god, this name should be familiar to old friends in the cryptocurrency circle. He started with a capital of ten thousand, forging ahead in the tides of the market. At the peak, he achieved profits of over four hundred times just through real trading, a feat that many investors can only dream of. By the time he chose to retire, his assets had accumulated to nearly fifty million.
Now, let me show you how this system achieves over 90% win rate in 100 trades, and what you need to do now is to quickly give a thumbs up.
2. Indicator Settings
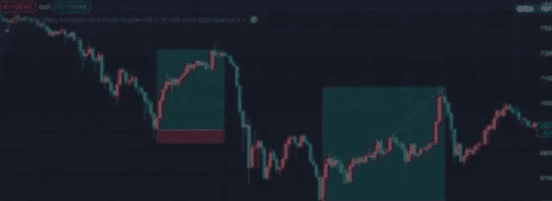
This trading system only uses two free TradingView indicators. Friends who do not use TradingView need not worry, as many software have these two indicators. The overall interface looks like this:
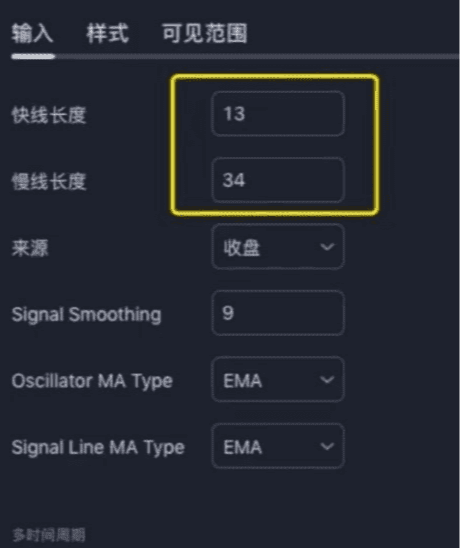
The first indicator used is MACD.
The histogram, the underlying logic of MACD will not be discussed here. We will only look at the usage.
The principle is very simple. When the upward or downward trend is strong, the peaks of the MACD histogram will become very high or deep. When the momentum weakens, the peaks of the MACD histogram will shorten.
In this system, MACD plays a crucial role as it verifies the continuity of price trends. To capture trading signals, we will closely monitor the dynamic changes of the MACD histogram, especially patterns of continuous increases or decreases.
It is worth noting that this is related to divergence.
The concept has a similar essence. However, success often depends on a little-known detail that is unfamiliar to most investors. When looking for divergence signals, be sure to pay attention to the significant gap between peaks. This phenomenon of continuous and significantly different peaks often contains richer trading opportunities.
Setting 1:
We set the fast line length parameter to 13 and the slow line length to 34, removing the crossover signals.
As shown below:
Setting 2:
The second indicator used is ATR.
, used to calculate stop loss points in this system. We set the parameters to 13.
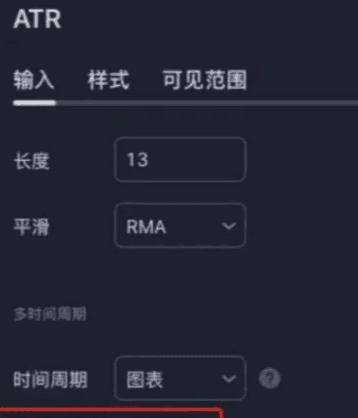
It's that simple. The above are all the indicators of this trading system. The entire trading system has clear and distinct entry and exit positions, allowing anyone to accurately determine when to enter and exit. Next, we will look at the actual operational effects of this system in conjunction with specific examples.
3. Indicator Usage
This is the 15-minute chart of Bitcoin:
Four Steps:
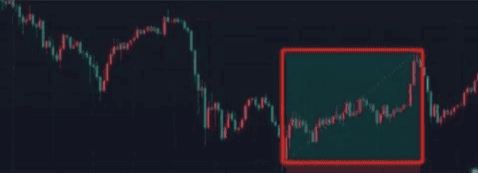
1. First, find two or three MACD histograms with significantly different and continuously increasing peaks.
2. Next, find the candlestick corresponding to MACD and check if the lows of the candlesticks are continuously decreasing.
3. The first solid MACD bar is converted into a hollow bar, and the corresponding candlestick of the first bar serves as our entry candlestick.
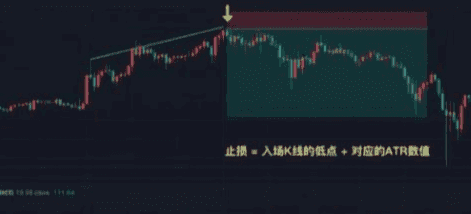
4. Use the low point of the entry candlestick minus the corresponding ATR value as the stop loss point.
If the risk-reward ratio reaches 1:2 as our profit target, then this trade has already exceeded its task. See the figure below:
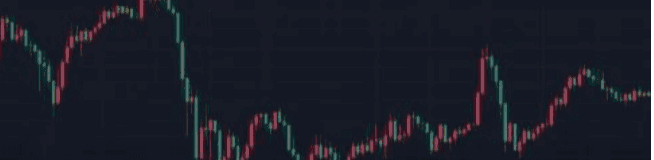
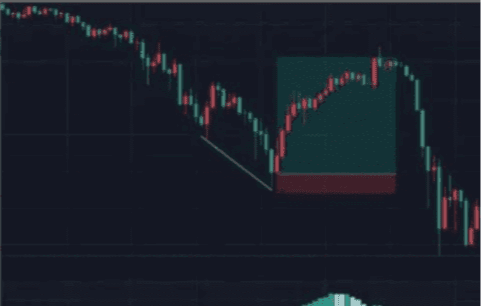
Look at an example of a short position; the short position also needs to meet these conditions, see the figure below:
1. First, find the MACD histogram peaks that are significantly different and continuously decreasing above the zero line.
2. Then check if the highs of the candlestick corresponding to MACD are continuously reaching new highs (preferably in a wedge structure).
3. The corresponding candlestick of the MACD solid bar converted to a hollow bar serves as the entry point.
4. Use the high point of the entry candlestick plus the ATR value as the stop loss point.
Profit-taking can also be chosen in batches at risk-reward ratios of 1:1, 1:2, or even higher, as we can see that this trade quickly achieved its target.
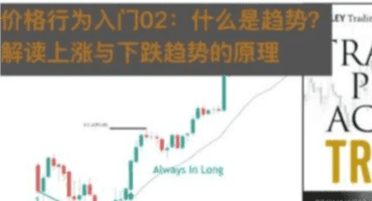
Regarding the second point, I won't elaborate on the principles. It is better to combine it with the principles mentioned in the article below. Friends who are interested can take a look.
Crosses: Introduction to price action 02: What is a trend? Interpreting the principles of upward and downward trends.
For other examples, please backtest on your own. If you find them good, feel free to come back and discuss.
4. Key Points
Key points for opening positions:
The price shows continuous peaks, two to three.
The MACD histogram shows a significant divergence.
Volume bars signal opening positions.
Stop Loss Principles:
Long Position: Stop Loss = Entry Candlestick's Low - Corresponding ATR Value.
Short Position: Stop Loss = Entry Candlestick's Low + Corresponding ATR Value.
Another indicator can be used. Considering that not all friends can use TradingView, the two indicators used in this article can be found in many software. Friends using TV can add 'divergence for many indicators V4' in the indicators, as shown below:
Automatically helps you find divergences, making it more convenient.
Finally, it should be noted that while the success rate is very good, it also reached about 70% under a risk-reward ratio of 1:2. The win rate can reach over 90% with a risk-reward ratio of 1:1.5. As for higher risk-reward ratios, you will see them in practice.
Therefore, which profit-taking method is most suitable for you, please consider carefully. Profit-taking can be done on the right side, letting profits run.
Most importantly:
Strictly set stop losses!
Strictly set stop losses!
Strictly set stop losses!
Don't get too excited! Don't get too excited! Don't get too excited!
This strategy is a counter-trend trading strategy. It has nothing to do with price action theory, although you could say that the divergence that emerges from the three pushes of the wedge bullish flag is this kind of divergence.
If you are considering using this trading system, then conducting a comprehensive market test is undoubtedly an essential step.
Through testing, you can find the trading varieties that are most compatible with this system, ensuring the maximum effectiveness of the system.
Participate in actual trading only after fully understanding and preparing.


