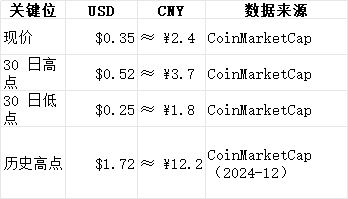
1. Price Range Overview (Adjusted)
## 2. Technical and On-chain Quick Read
1. Technical Formations
- Daily Line: After falling from the 30-day high of $0.52, it has formed a sideways consolidation in the $0.30–$0.36 range.
- 4h Line: Short-term shows a 'double bottom' structure, $0.30 support is effective, but volume is shrinking, need to wait for a confirming bullish candle.
- EMA: Price is still below the 50-day EMA (≈$0.39), short-term bearish; if there is a volume return above $0.39, it can be seen as a signal of strength.
2. On-chain/Order Book Snapshot
- Gate Depth: Approximately 1.2 million LA orders on the $0.30–$0.32 order wall, accounting for about 4% of the circulation, strong short-term support.
- Staking Rate: Official dashboard shows 41% of circulation is staked, selling pressure is relatively controllable.
- Unlock Calendar: On September 5, 6.8% of circulation will be linearly unlocked, need to be cautious of pullbacks before the event.
---
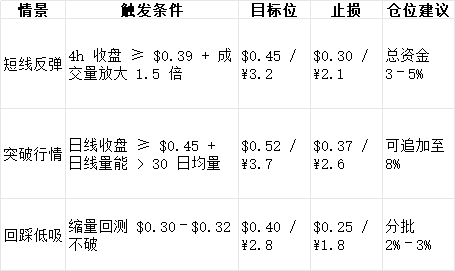
## 3. Scenario Simulation and Trading Plan
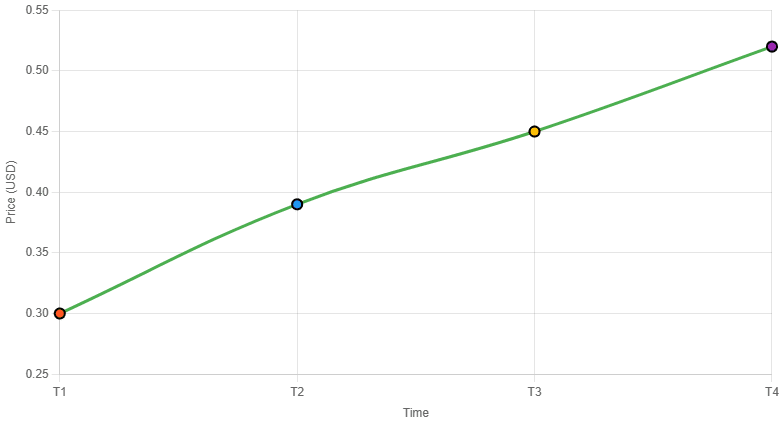
## 4. Illustration (please refer to CoinMarketCap for operation)
1. Time Period: Select '3 months' daily line.
2. Indicator:
- 50-day EMA (Green)
- Trading Volume (Bar Chart)
3. Manual Annotation
- Green Horizontal Line: $0.30 support
- Red Horizontal Line: $0.39 short-term strength level
- Blue Arrow: September 5 unlock time point
## 5. Conclusion (TL;DR)
- Current price $0.346 / ¥2.4 is in the low range of the past two months; if there is a volume breakout above $0.39, a rebound to $0.45–$0.52 can be anticipated.
- Medium to Long-term Observation:
1. After the unlock in September, whether the selling pressure is absorbed;
2. DeepProve commercialization progress (paid customers, on-chain proof fee growth).
- Risk Control: Maximum single loss ≤ 2% of total funds, avoid heavy positions before unlock.