Preface: The original intention of starting this collection is to cooperate with another album on wave theory teaching and practical combat, because the teaching content may be boring and tedious, and this is also a way to share and summarize my trading ideas, and to improve myself.
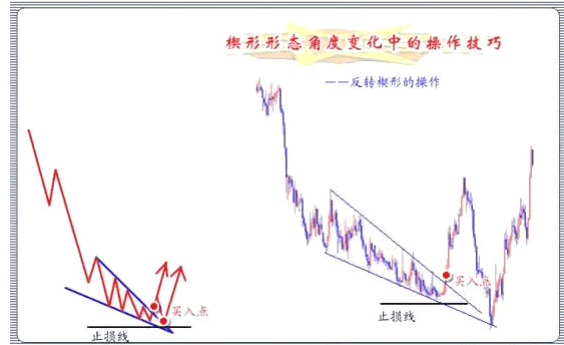
Yesterday, in the wave theory tutorial, I devoted an entire article to explaining the ending contracting triangle, which I prefer to call a wedge. However, in order to distinguish it from the leading contracting triangle, we will not change its name. As the name suggests, the word "ending" often implies a reversal. That's right, it is a reversal pattern, divided into ending ascending contracting triangle (ending ascending wedge) and ending descending contracting triangle (ending descending wedge), one appearing at the end of an upward trend and the other appearing at the end of a downward trend.
First, let's review the two examples of the ending contracting triangle:
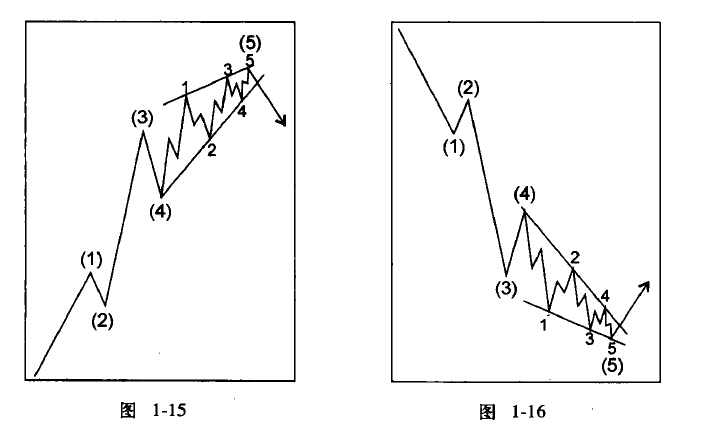
Note: The ending contracting triangle mainly appears in the fifth wave position, and rarely in the C wave position (or double three wave wave C). It is a motive pattern, not a motive wave, because the sub-waves are expressed in 3-3-3-3-3 mode. The wedge is formed by the convergence of two lines, one flat and one steep. It is different from the triangles studied in the charts later, so I give a reminder here.
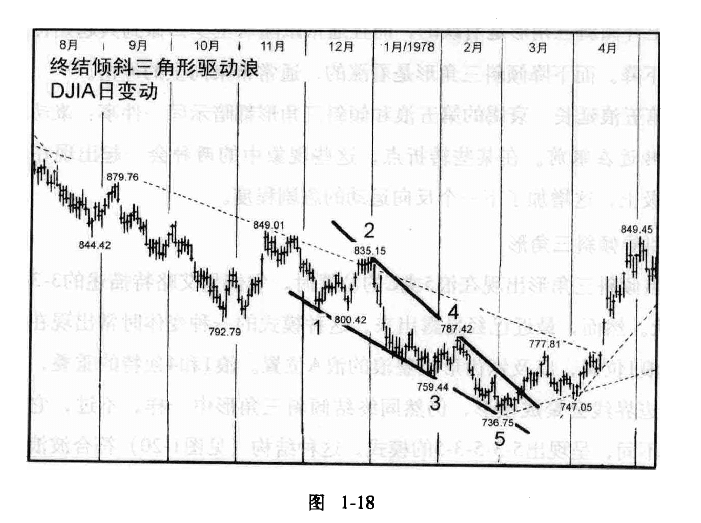
Three examples in the original book:
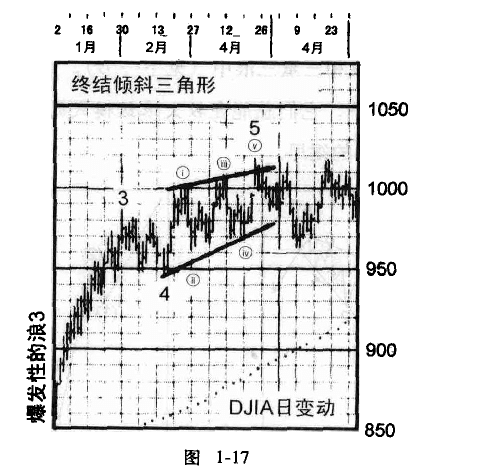
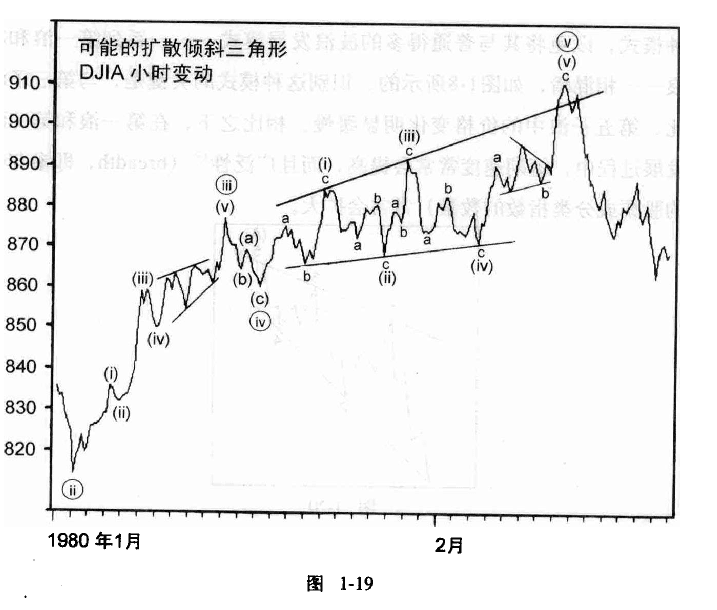
Within the ending contracting triangle, waves 1, 3, 4, and 5 all reached the resistance line of the upward trend, but wave 2 did not. Wave 5 even crossed the resistance line, indicating strong momentum, but then returned into the contracting triangle, forming a price apex. The subsequent market development was also very interesting: after breaking below the lower support line and falling for a distance, it climbed to near the high point of wave 5, and then started a downward trend. What does this indicate? The high points of waves 1 and 5 are short-selling points, and climbing to near the high point is also a short-selling point. However, in the actual market, it is possible that after the high point of wave 5 appears, it will go down all the way, not giving us a second chance.
Look closely at the chart and find 2 points: 1. The 3rd wave touched the lower support line twice, and the 5th wave approached the support line for the first time and rebounded upward and approached the upper resistance line, and then tested the lower support line again, so can we also mark it as the 7th wave? Because in the example chart above, wave 2 did not reach the lower support line either, I personally think that the meaning of waves 5, 7, and even 9 is the same, so is it possible that wave 3 will rebound? (There are such cases in the 30min small cycle).
Because we all know a common sense: two points determine a line. After waves 1 and 3 are completed, we can draw a support line, but what about the resistance line? We can only draw another resistance line after wave 4 comes out. And the two lines must be one flat enough and one steep enough. The support line is flat, indicating that although the price is falling, the decline has slowed down. So if we are holding a short position, we should consider closing the position at the end of the 5th wave, because the later shape will be reversed, although it may test the lower support line again, but what if it doesn't turn back? Also, in general, after breaking through the upper resistance line, there will be a pullback confirmation action. There are two possibilities, reaching the upper resistance line or testing the lower support line again, which is the lower edge (both points are opportunities to build a position)
So to sum up: when the 5th wave appears, you should try to build positions in batches. If there are 7th or 9th waves, they are all opportunities to add positions, but you must control your position size well, in case the price goes down? So no matter how you operate, you must set a stop loss in order to prevent unexpected emergencies and protect yourself.
There is also a variant of the ending contracting triangle, the expanding contracting triangle, which is not subject to too much judgment (because the original author said so)
Expanding Contracting Triangle
After explaining several examples, let's review the ETH strategy yesterday:
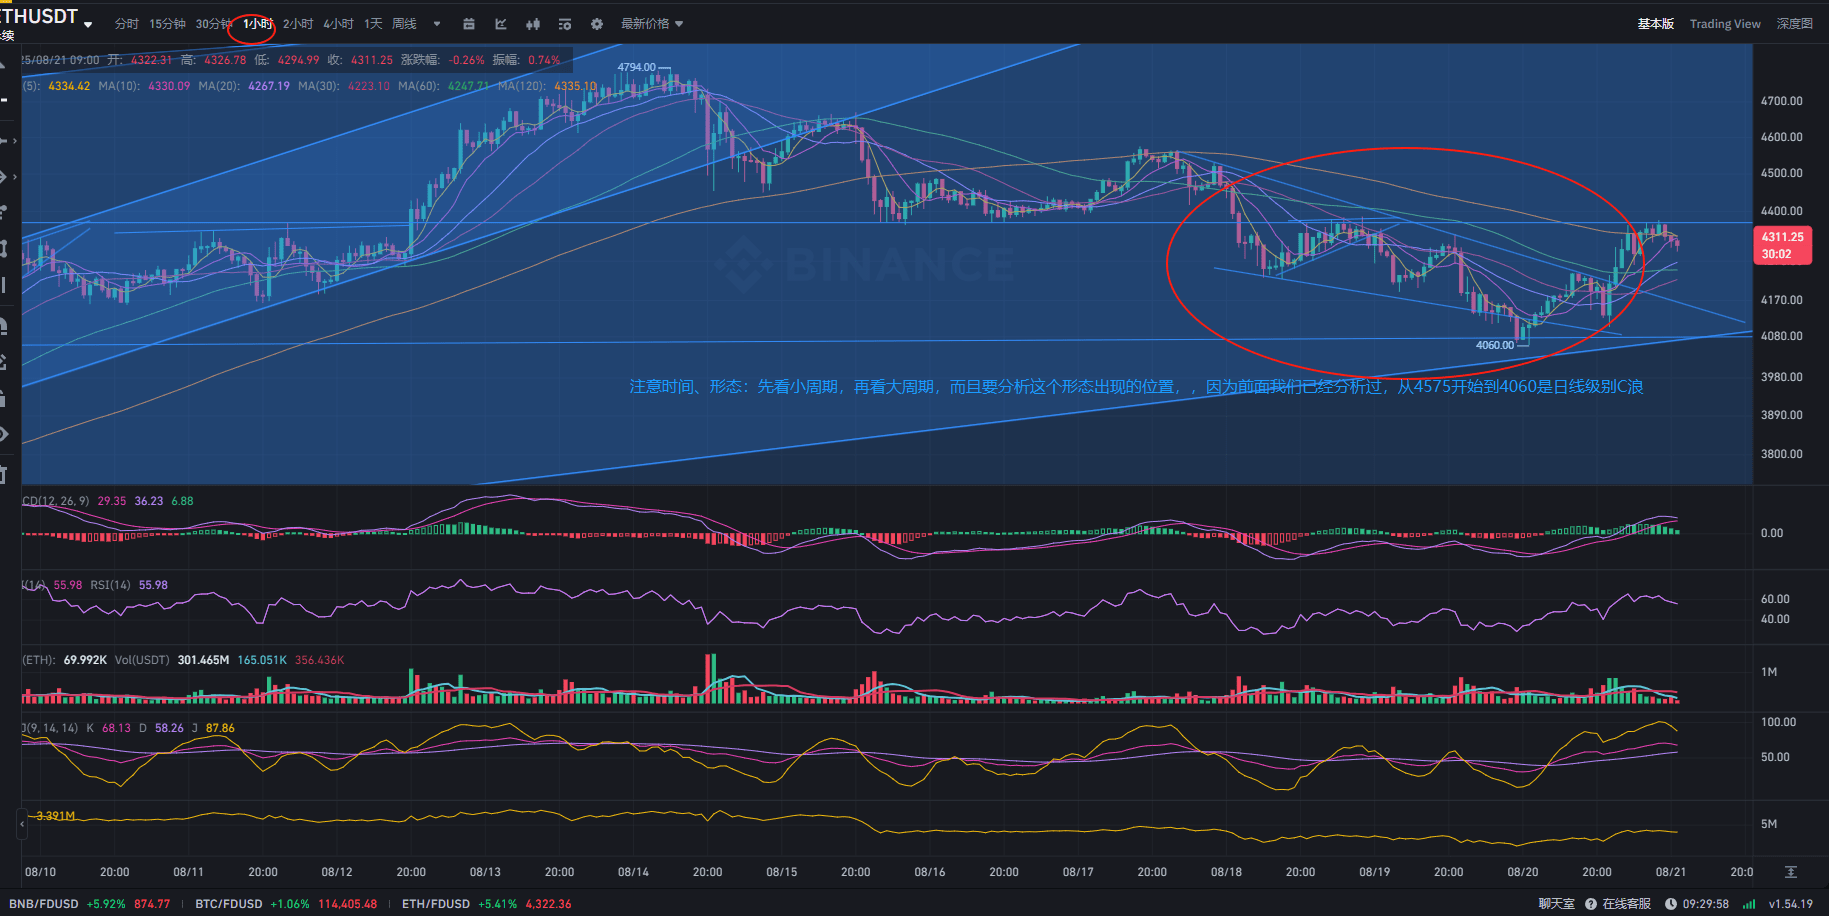
Pay attention to the time and shape: look at the small cycles first, then the large cycles, and also analyze the position where this shape appears, because we have already analyzed earlier that from 4575 to 4060 is the daily level C wave, and the combined flat correction Y wave is basically the same as the C wave; but yesterday a breach phenomenon occurred near the lower support line of 4130, falling to 4060 at one point, so let's draw a third line (support line), so why did such a big breach occur? Look at the fundamentals, it turns out that Nvidia plummeted by 3.5% on August 19, and NQ100 fell by 1.35% (which is actually a relatively large fluctuation), all risky assets are being sold off, and the stampede under panic is also normal.
After discovering this wedge pattern, I promptly provided a timely reminder in my updates yesterday, focusing on the potential loss or gain at the upper resistance level of 4190-4220. I cancelled the short-selling because a reversal pattern requires a change in mindset. The market development in the evening was quite dramatic. Before the US stock market opened, there was another small pullback to 4146 at 19:00, but it quickly recovered and rebounded to around 4220, indicating strong support below. However, the real test came with the opening of the US stock market. Nvidia continued to be sold off, NQ100 opened lower and trended downwards, indicating that panic was still ongoing. BTC continued to fall sharply, breaking the morning low and reaching a new low for the day. ETH followed BTC's decline, falling to 4106, spreading panic. The turning point occurred at 10 o'clock. NQ continued its decline, but BTC and ETH seemed to decouple from NQ. ETH began to challenge the resistance level of 4220 and successfully broke through it before 12 o'clock. Everything was progressing in a positive direction. NQ only stopped falling at 0 o'clock, but ETH had been rising steadily, testing the resistance level of 4300. The subsequent market development was basically within expectations, so I won't elaborate further.
But there is still a small problem. In the chart I posted yesterday, because the upper pressure trend line did not connect two high points, I mistakenly judged that it broke through the trend line at one point yesterday afternoon, and I will correct it again, but the overall idea is still worth referring to. Also, the entry point and stop-loss point I suggested yesterday actually referred to this chart.