During the eleventh issue, I mentioned that I would dedicate an episode to discuss tops and bottoms, because the length and duration of a wave usually depend on the measurements and projections starting from the orthodox endpoint.
The concept of orthodox tops and bottoms is very important, mainly because successful analysis always depends on the correct labeling of various wave patterns. Sometimes incorrectly assuming a specific price extreme as the correct starting point of a wave marking can lead the analysis astray. Therefore, it is crucial to correctly identify the orthodox tops and bottoms.
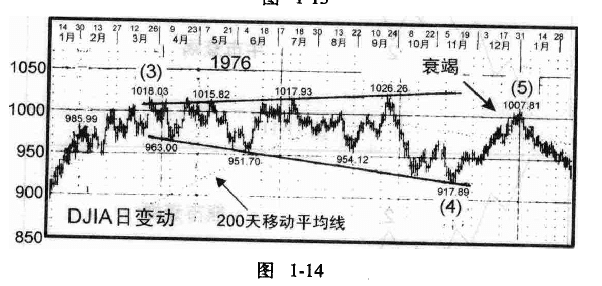
Sometimes, the endpoint of a driving pattern does not align with the corresponding price extremes. In this case, the endpoint of the pattern is referred to as the 'orthodox' top or bottom, distinguishing it from the actual highest or lowest prices that occur.
For example: