📌 Last price: 114,202 USDT (+1.25%)
24h high: 114,569
24h low: 112,301
24h volume: 131,591 BTC
Visible indicators on the chart:
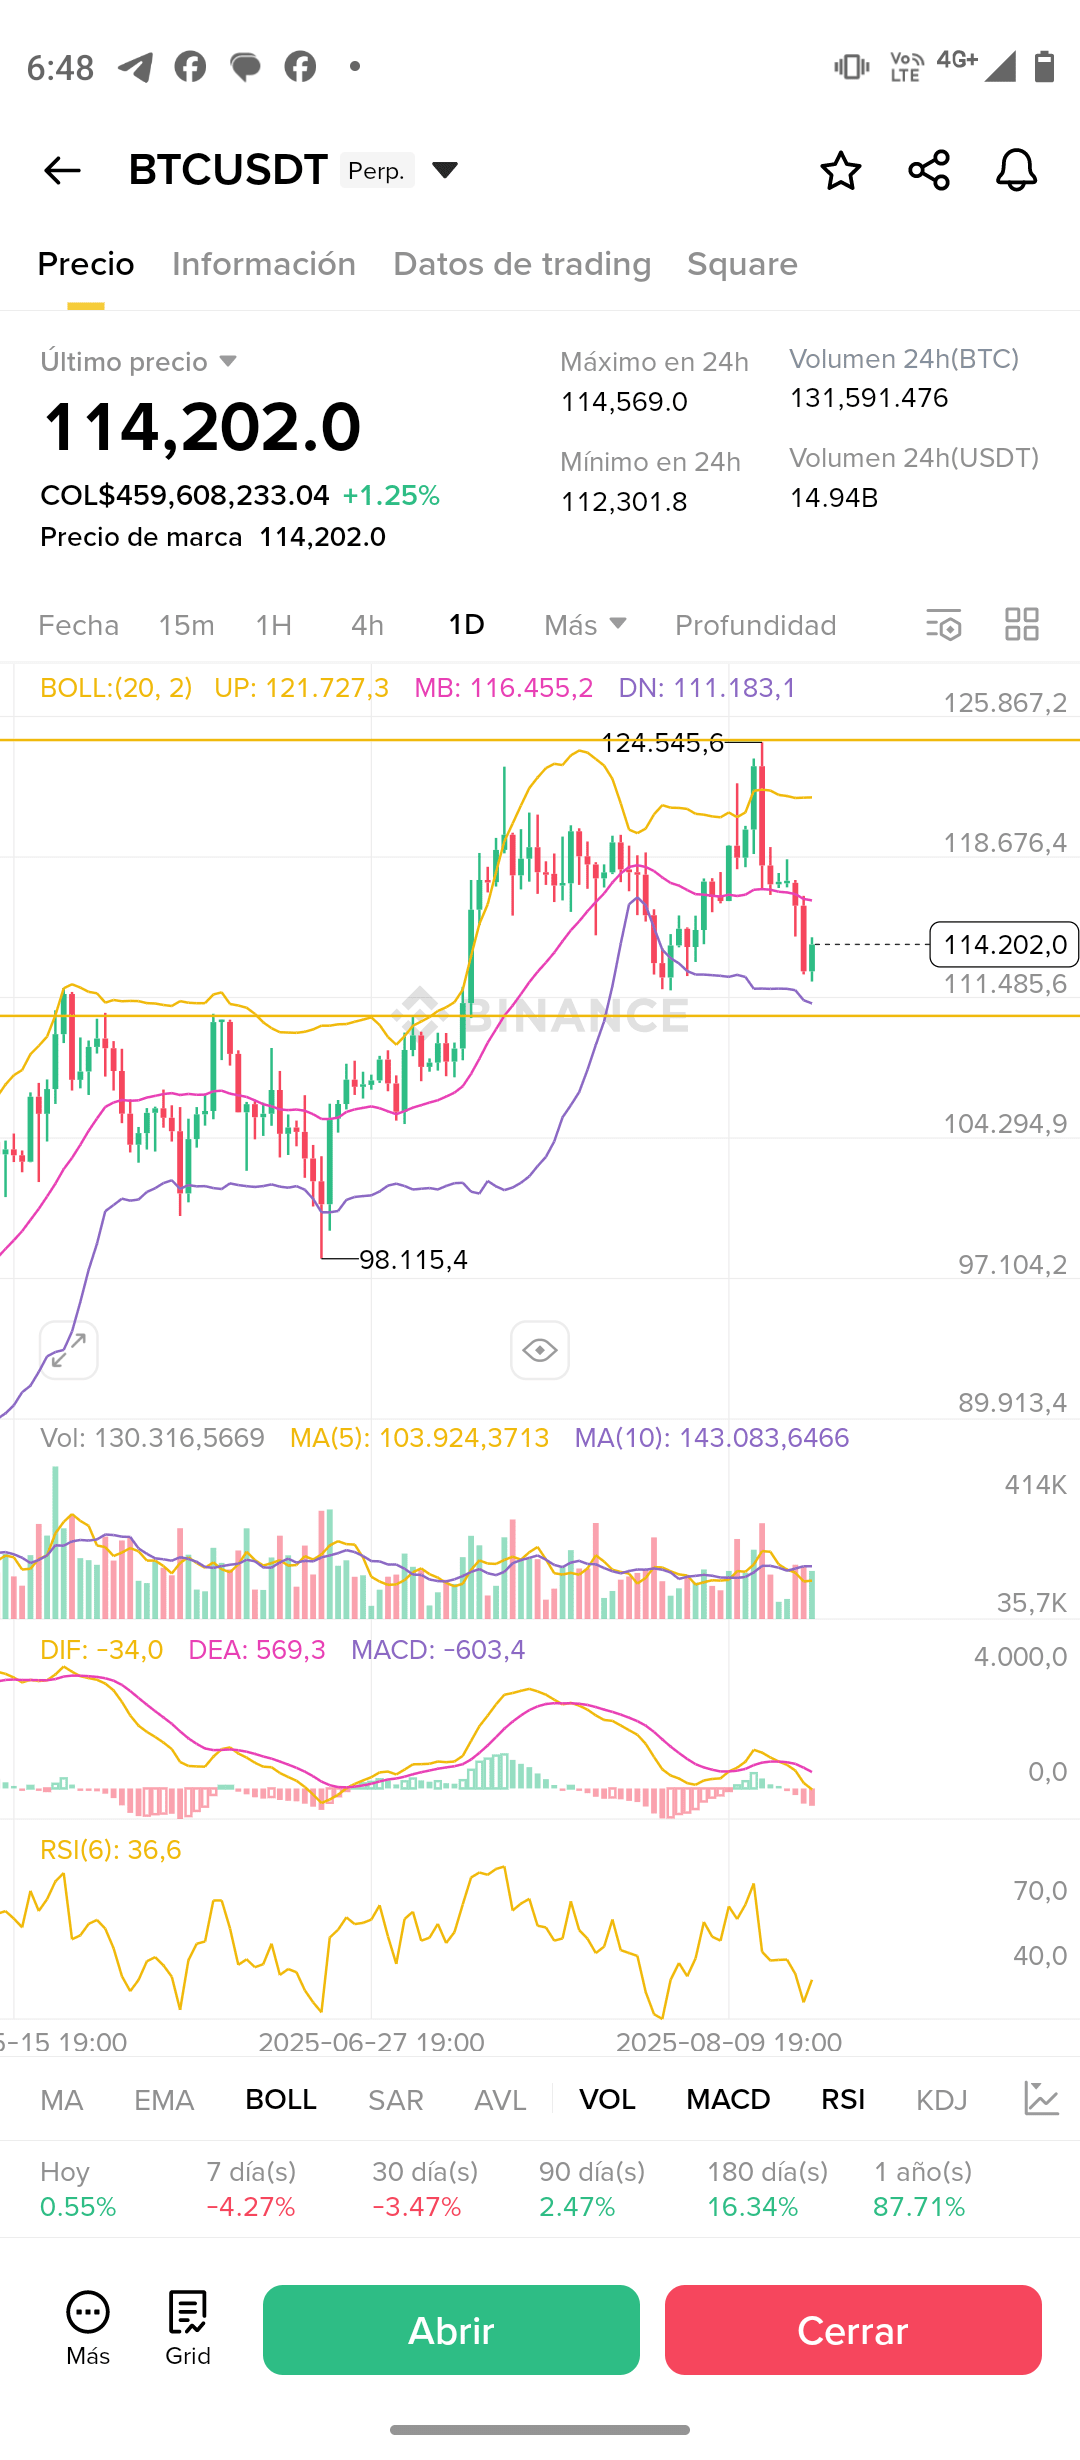
1. Bollinger Bands (BOLL 20,2):
Current price (114,202) is located near the low-medium (116,455 ≈ central average), indicating recent bearish pressure.
The lower band is at 111,183, which acts as immediate key support.
2. Moving Averages:
MA(5): 103,924 — quite below, showing that the previous rise was rapid.
MA(10): 143,083 — very high, indicating a strong correction in recent days.
3. MACD:
DIF: -34.0, DEA: 569.3, MACD: -603.4.
Confirmed bearish crossover, with negative momentum, reflecting weakness in the short-term trend.
4. RSI (6): 36.6
RSI is approaching the oversold zone (<30), showing seller exhaustion and possible technical rebound.
Important technical levels:
Immediate support: 111,183 (lower Bollinger).
Major support: 98,115 (relevant low on the chart).
Immediate resistance: 116,455 (Bollinger average).
Strong resistance: 121,727 (upper band).
📈 Projection for tomorrow (short term):
If BTC respects the support of 111,183, there is a probability of a rebound towards 116,000 – 118,000.
In case of losing 111,000, the drop could extend towards the 108,000 – 105,000 zone.
Bearish pressure continues, but indicators show exhaustion in selling, which allows room for a short-term technical rebound.
✨ Conclusion:
The market is in a correction phase within a larger bullish trend. The key is for the bulls to defend the 111,000 USDT zone. Otherwise, BTC could seek lower levels.
👉 If you want more daily analysis, strategies, and a clear market view, follow me so you don't miss the next big opportunity in the crypto world. 🚀

