$ETH continues to show strength on the daily chart, holding above crucial support levels.
🔑 Key Highlights
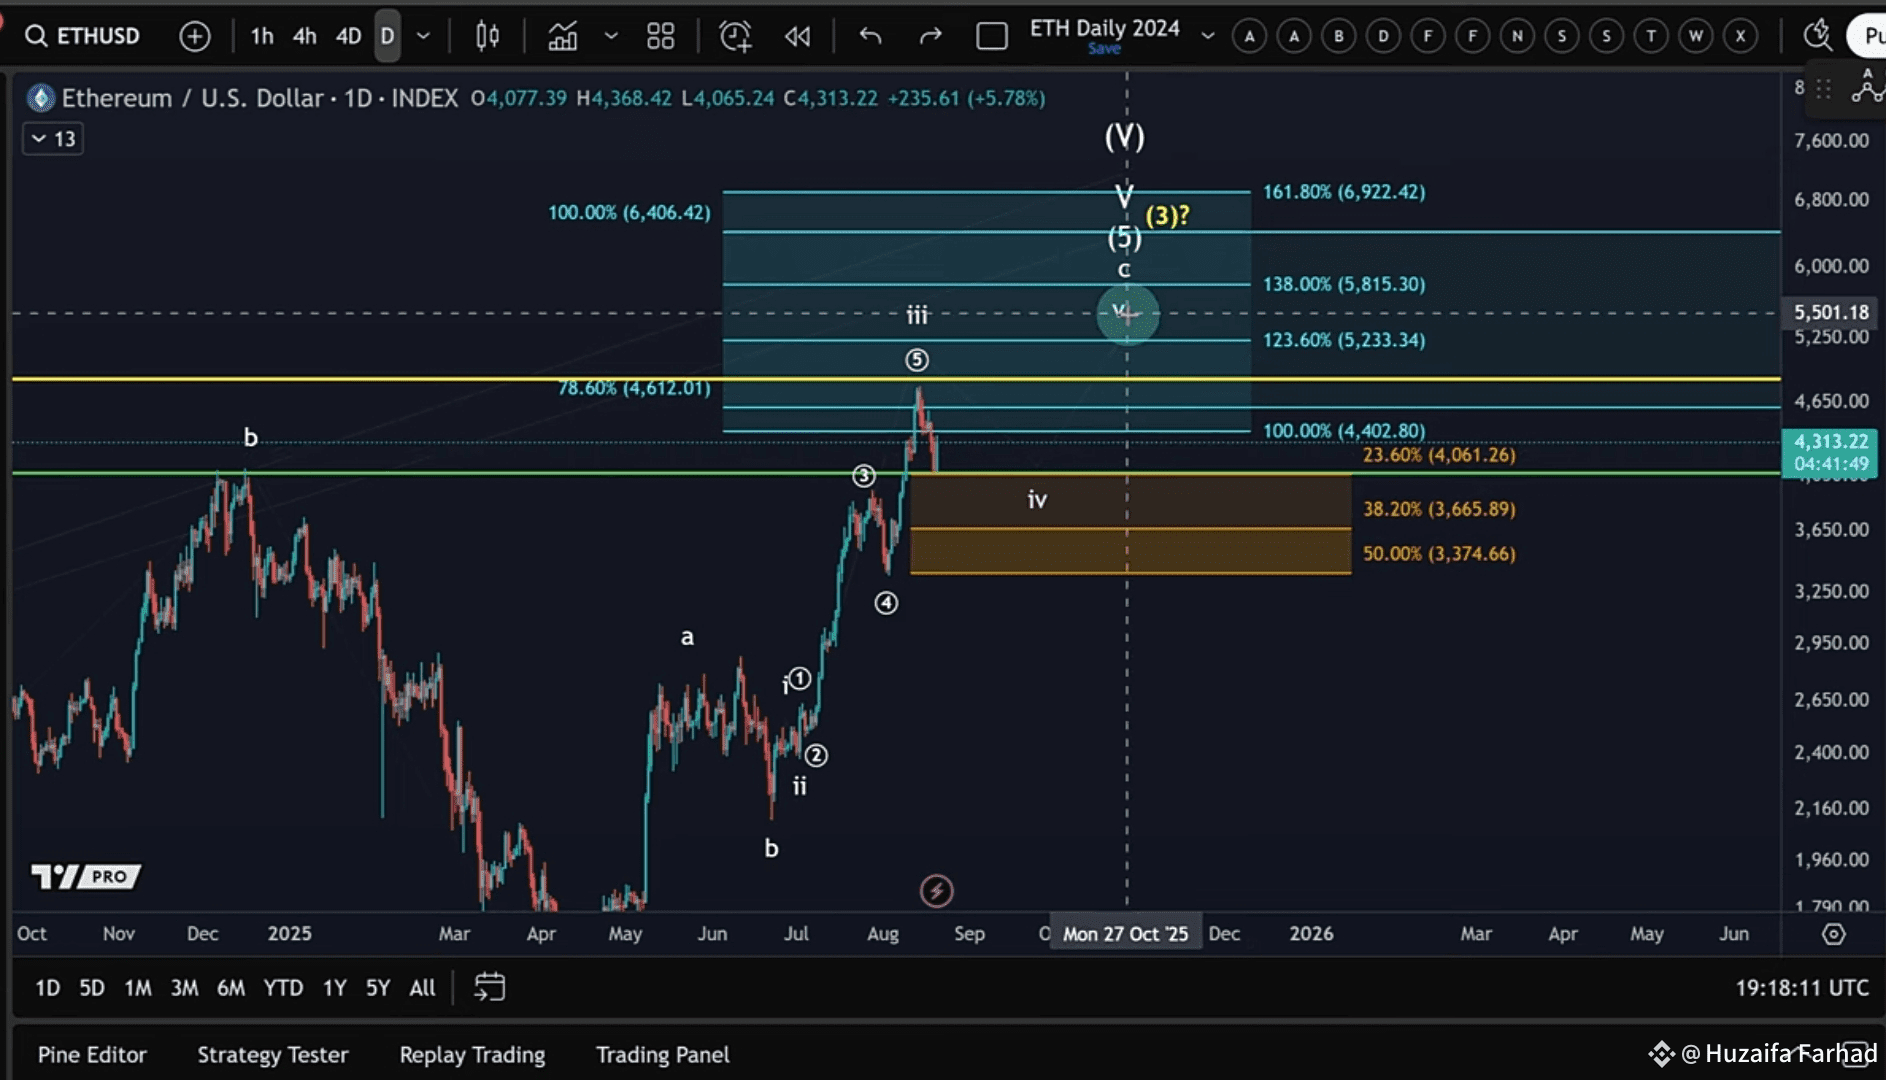
ETH remains above $4,100, a former resistance now acting as support.
Liquidity at $4,100 has been cleared, confirming strong buy orders in that region.
Short-term structure suggests ETH may still be within Wave 4, with an A-B-C corrective move unfolding.
As long as price holds above $3,374, the bullish pathway remains intact.
📊 Support & Resistance Levels
Immediate Support: $4,100 (flipped from resistance, liquidity cluster zone)
Secondary Support: $3,665
Major Support: $3,374 (aligns with August swing low)
As long as ETH trades above $3,374, I continue to track the probability of one more high before a deeper correction.
🔍 Short-Term (30-Minute Chart) Analysis
Looking at the intraday chart:
Wave 3 topped on August 14.
ETH is now likely in a Wave 4 correction.
We’ve seen an A-wave down, followed by a B-wave bounce (currently unfolding).
The upside so far remains a 3-wave move, which strengthens the case for a corrective B-wave rather than a new bullish impulse.
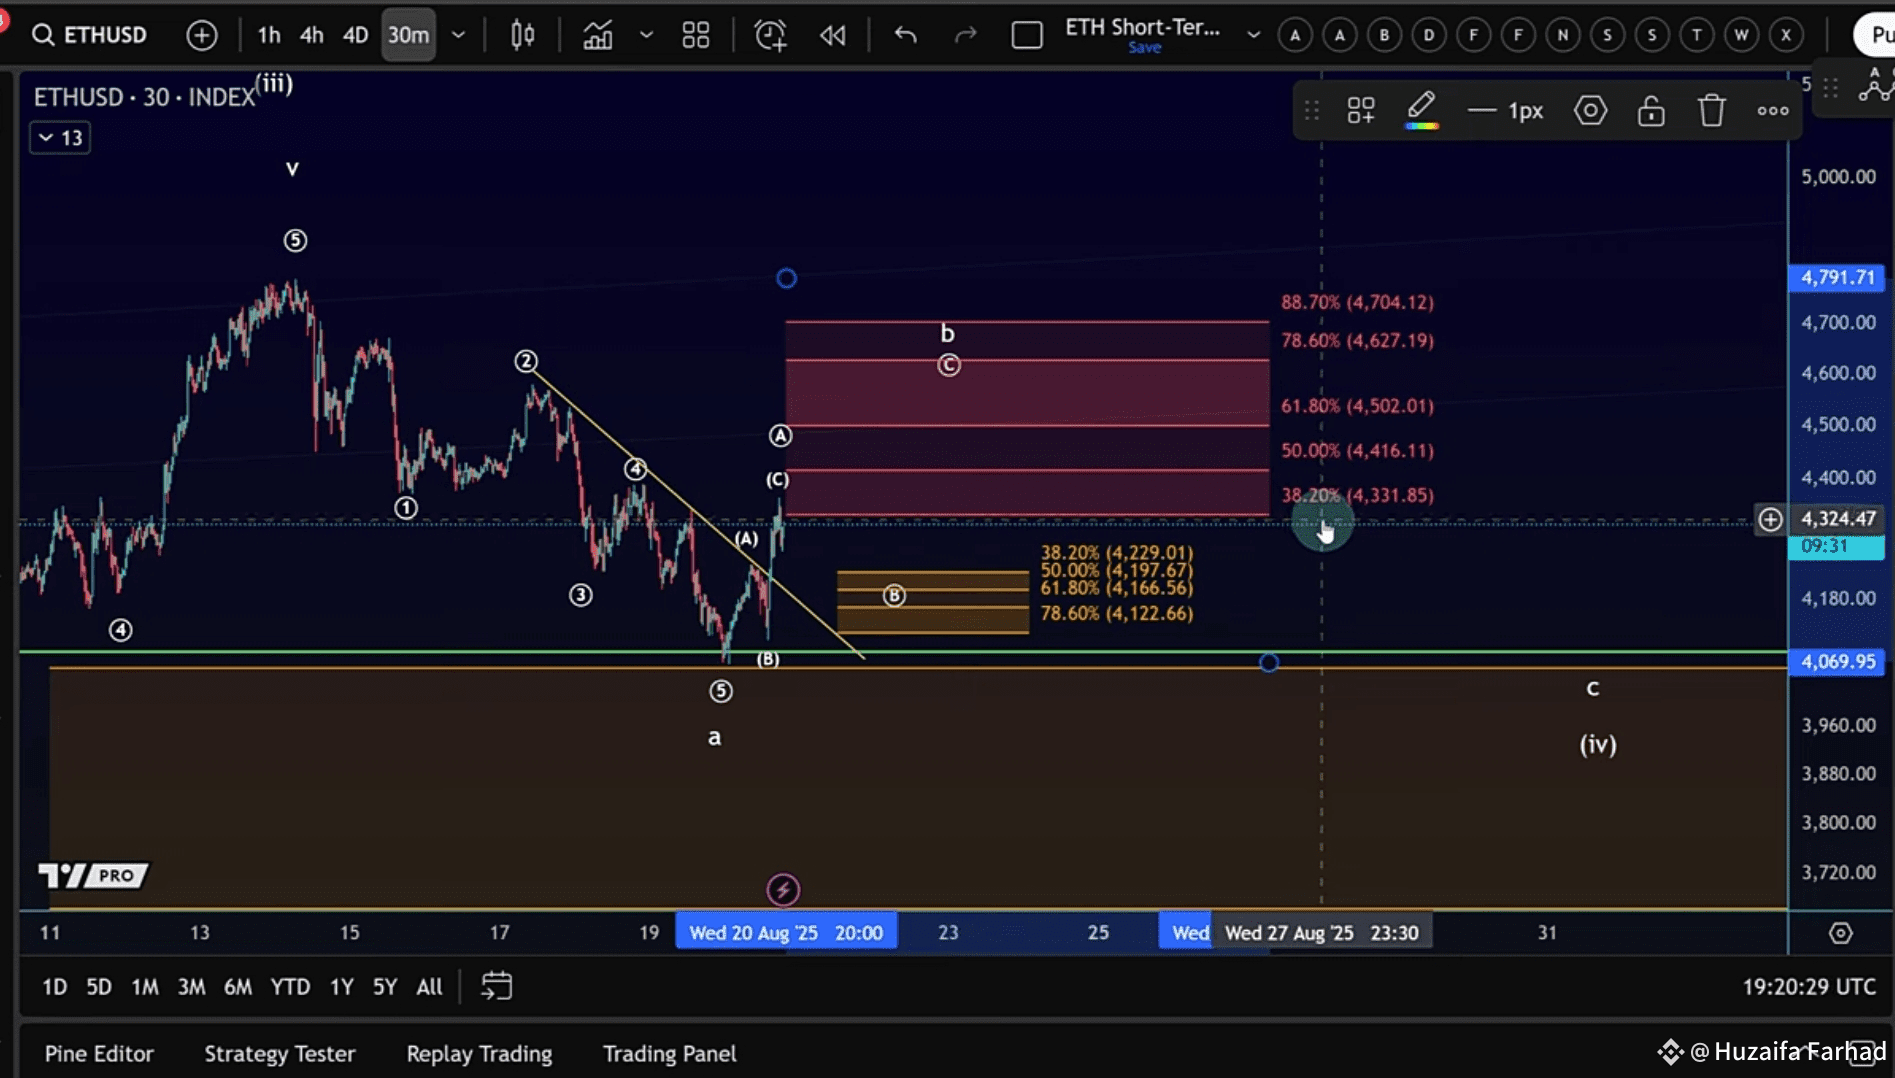
🎯 Fibonacci Levels
Resistance Zone: $4,331 – $4,474 (standard Fibonacci cluster)
Micro Support: $4,130 – $4,250 (to be adjusted as price develops)
Note: B-waves can overshoot, so don’t be surprised if ETH briefly pushes higher before starting Wave C of this correction.