In short.
Shiba Inu's price is down 0.6% daily and over 17% monthly, with active addresses nearing historical lows.
Bearish EMA crossovers confirm downside risks, with possible target levels at 0.00001215 and 0.00001160.
Despite the gloomy market sentiment, the accumulation by the top 100 wallets and positive CMF readings bring a glimmer of bullish hope.

Over the past 24 hours, Shiba Inu's price has shown little fluctuation. As of the time of writing, its price has only dropped by 0.6%, which is generally in line with the overall downward trend in the meme coin market. However, the overall situation seems to be worse.
Over the past 30 days, the SHIB index has fallen by more than 17%. In this context, bearish signs are starting to emerge rapidly. However, there is a strong indication that could change the market tone.
The number of active addresses is approaching a monthly low.
The first dangerous signal comes from the network itself. The number of daily active addresses for SHIB continues to decline and is now close to a monthly low. This metric currently stands at 3,148, slightly above the month-over-month low of 3,130.
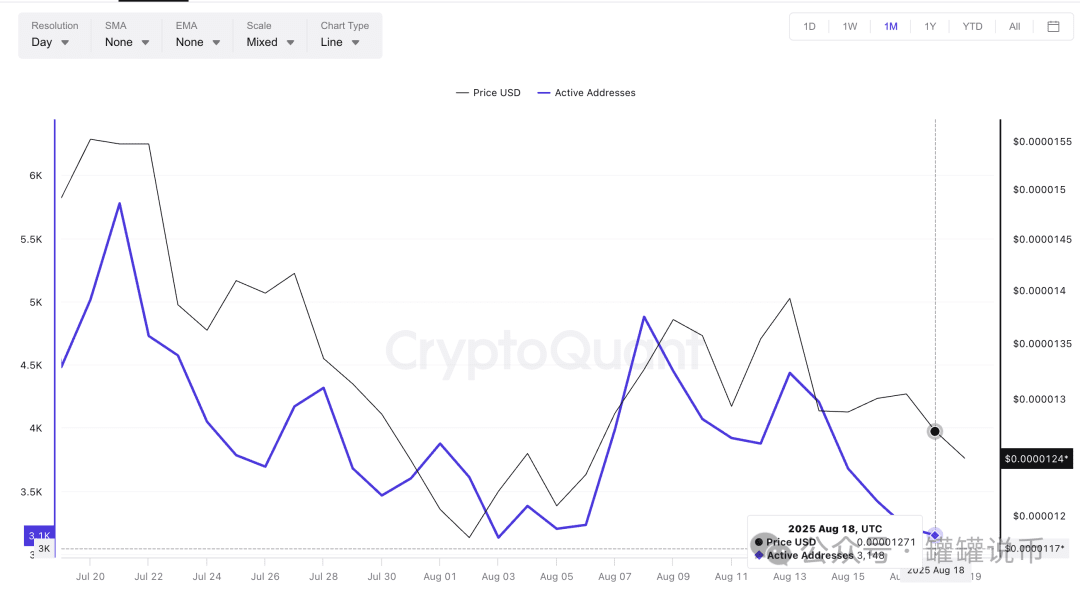
This is important because past surges in active addresses have always preceded price increases. Between August 6 and August 8, the number of active addresses surged, and SHIB's price responded almost immediately.
Although the decline appears modest on paper, this drop in trading activity aligns with bearish behavior. The Bull-Bear Power (BBP) indicator shows rising selling pressure, indicating that short sellers are slowly gaining control of the price momentum for Shiba Inu.
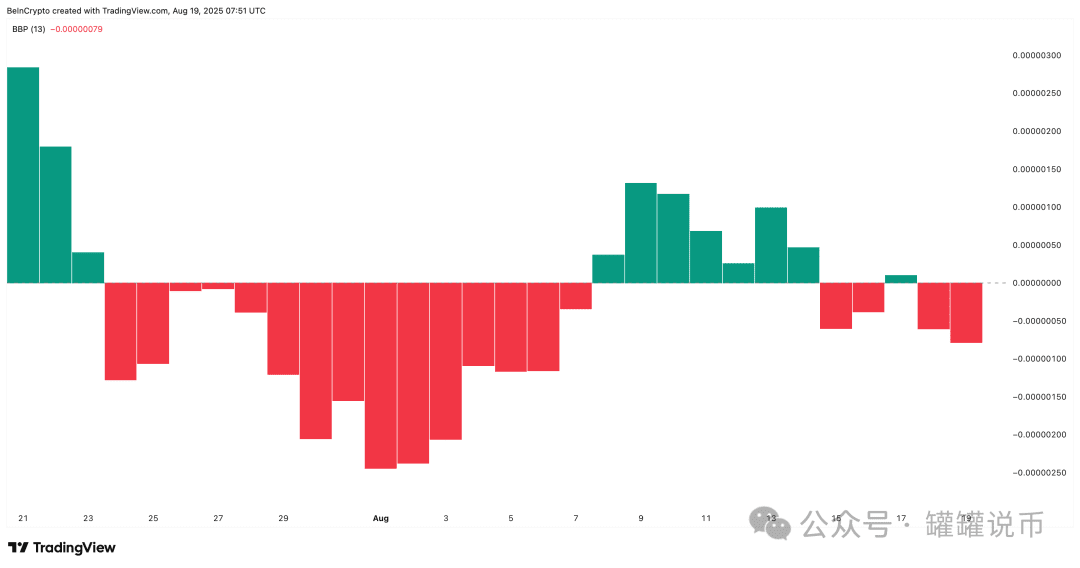
The Bull-Bear Power (BBP) indicator measures the difference between the daily high/low price and the moving average to determine whether bulls or bears are currently controlling the price trend.
A key buyer may be delaying transactions.
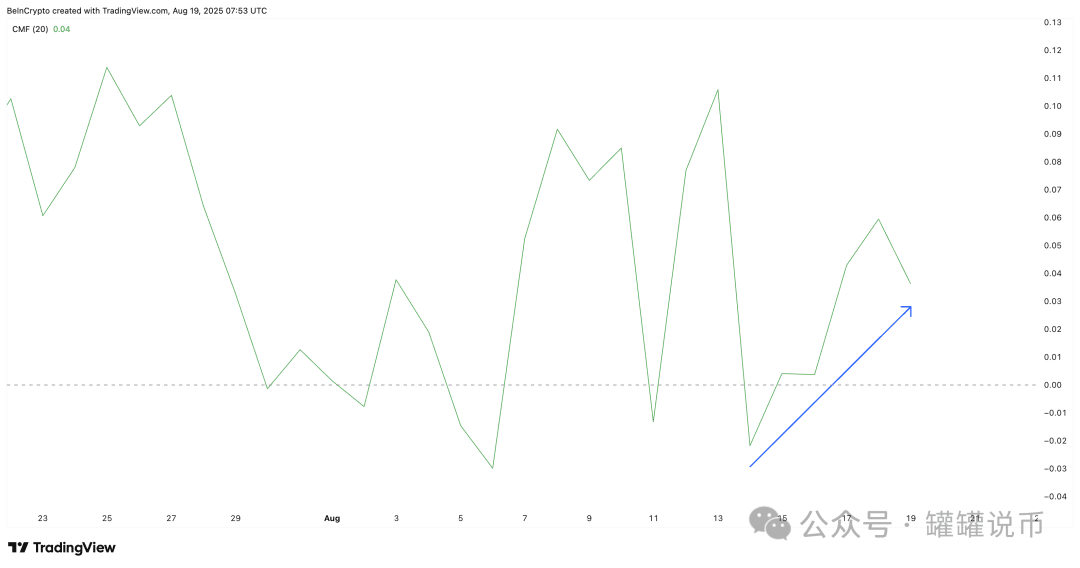
Despite weak market activity and increased bearish momentum, there is one indicator that has not risen. The Chaikin Money Flow (CMF) remains above the zero line, indicating a net positive capital inflow for SHIB. This situation typically occurs when major participants are buying while others are exiting.
From a technical standpoint, the higher low set by the CMF indeed indicates an increase in funds flowing into the specific asset.
In-depth analysis reveals that this aligns with the behavior of the top 100 wallets. These wallets have accumulated trillions of SHIB recently, totaling nearly 21 trillion SHIB over the past 90 days.
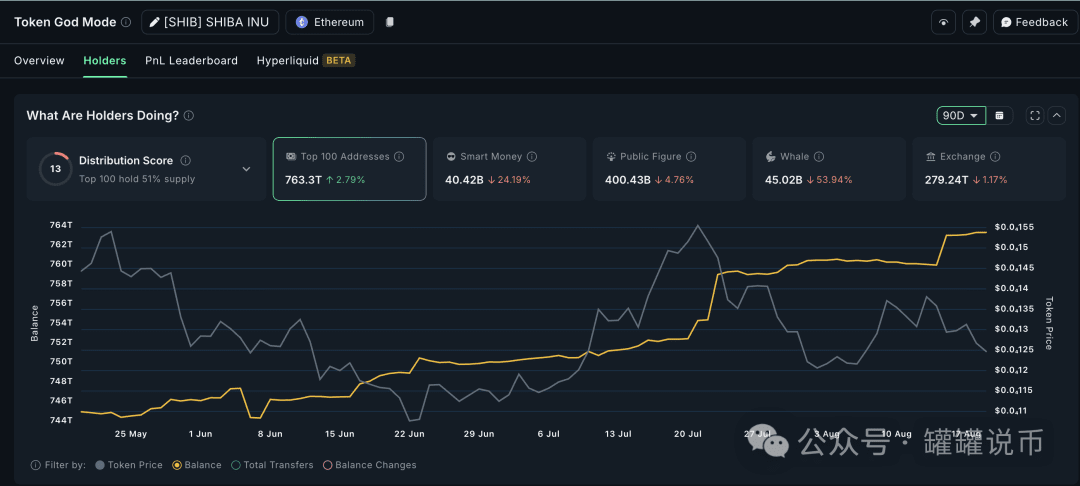
Therefore, although 'smart money' and 'whales' have reduced their positions, the holdings of the top 100 addresses have significantly increased. The rise in CMF is likely reflecting this influx of funds.
CMF shows buying or selling pressure by combining price and volume; values above zero indicate accumulation, while values below zero indicate distribution.
Bearish crossovers indicate that the price of Shiba Inu will decline further.
The SHIB chart bears clear technical warnings. On the daily chart, the 20-day EMA (exponential moving average) or the red line has fallen below the 50-day EMA (orange line). Significant pullbacks typically follow this bearish crossover.
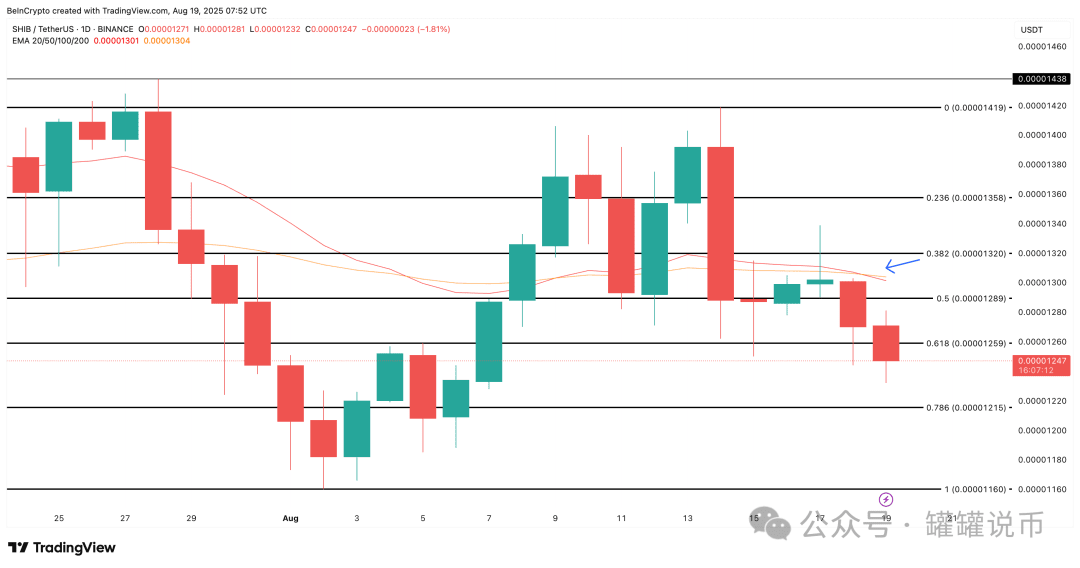
Meanwhile, the price has fallen below the support level of 0.00001259 and is currently trading around 0.00001247. If the sell-off continues, the next price bottom will be around 0.00001215. If this support level is breached, 0.00001160 could become the target, marking a further deepening of the 30-day correction.
Only a thorough breakout above 0.00001320 can break this bearish expectation. This level would reverse the moving averages and restore short-term momentum, but until then, downside risks remain predominant.

