First, let's discuss U.S. inflation in July (CPI and PPI).
On August 12th, the U.S. Bureau of Labor Statistics released the inflation data for July. The overall CPI rose 2.7% year-on-year and 0.2% month-on-month. Core CPI rose even higher, at 3.1% year-on-year and 0.3% month-on-month. The increase in core services was particularly significant, rising 3.65% year-on-year, marking a second consecutive month of accelerated growth. This means that inflation is primarily being driven by core services, which include housing, healthcare, insurance, telecommunications, travel, entertainment, education, community services, and auto repair. The annualized inflation rate for this sector in July reached 4.5%, the highest in six months. This indicates that essential services in daily life are becoming increasingly expensive. Why is the market so focused on CPI? Mainly to see if Trump's tariff war has pushed inflation higher. When analyzing tariffs, we can set services aside for now, as they are not involved in imports and exports and thus are not affected by tariffs; tariffs mainly target goods, especially imported goods.
First, let's analyze durable goods:
The largest category is automobiles. New car prices had previously fallen for three consecutive months and remained flat in July. New cars are tied to imports, but the burden of tariffs is still being shouldered by foreign manufacturers and U.S. importers, so consumers haven't felt it. As for used cars, they are not imported and do not involve tariffs, but prices have surged over the past year, becoming a major driver of price increases in durable goods.
The second category is household goods. Prices rose 0.4% month-on-month in June and accelerated to 0.9% in July. Notably, outdoor equipment, windows, flooring, and linen products saw significant increases, with June hitting a historical high of +4.2% and continuing to rise by +1.2% in July. It is evident that tariffs have started to affect household goods and are now reflected in prices.
The third category includes sports goods and hardware tools. Prices rose 1.4% month-on-month in June and 0.4% in July. Although the increase was not as dramatic as in the previous month, the annualized rate is still quite high. Particularly, hardware tools have seen monthly increases of over 1% since April, with a 1.2% rise in July, equating to an annualized increase of over 10%. The impact of tariffs on these products is also evident in July's data.
The fourth category consists of information technology products, such as computers and phones. Prices fell 1.4% month-on-month in July and 5.9% year-on-year. This means that although tariffs have a price-increasing effect on these products, the downward pressure from technological upgrades is stronger, leading to price declines.
Overall, since the pandemic in 2020, the CPI for durable goods has surged by 25%. Following that, the Fed raised interest rates and reduced its balance sheet, leading to a continuous decline in prices, which are expected to bottom out around August 2024. Prices fell slightly in May, remained stable in June, and rebounded in July, with a month-on-month increase of +0.36% and a year-on-year increase of +1.2%. This indicates that companies that made large profits in previous years are now having to bear the costs of tariffs. However, in July, some categories of household, sports, and hardware goods have already shown that part of the tariff burden is being passed on to consumers.
Analysis of daily necessities (non-durable goods)
Electronics decreased by 1.4% in July and fell by 5.9% year-on-year, as mentioned earlier.
Toys, which saw increases of +1.3% in May and +1.8% in June, saw the growth rate shrink to +0.2% in July, but the industry generally believes prices will rise further. Clothing and shoes had an overall increase of only 0.1% in July, but shoe prices surged by 1.4%, marking the largest monthly increase in four years. Yale University even conducted a study indicating that tariffs have a significant impact on clothing and shoes, predicting short-term price increases of 40% for shoes and 38% for clothes, with long-term estimates of +19% and +17%, respectively. Particularly for shoes, 34% are imported from Vietnam, making it almost inevitable that tariffs imposed will be passed on to American consumers! Therefore, the impact of tariffs on daily necessities has already become evident in toys, clothing, and shoes. More importantly, all of Trump's tariffs officially took effect on August 7th, so August's CPI is sure to be worse than July's. July's PPI was even more alarming, jumping from +2.3% in June to +3.3% year-on-year, far exceeding market expectations of +2.5%. The month-on-month increase was even more dramatic at +0.9%, marking the highest increase in three years, while the previous month had been 0. Core PPI rose by +3.7% year-on-year and +0.9% month-on-month. Of note is that core services PPI rose +4% year-on-year and +1.08% month-on-month, which, when annualized, equates to +13.8%—the most serious PPI rebound since inflation peaked in March 2022.
PPI mainly reflects transaction prices between businesses, indicating how companies are absorbing tariffs—whether they bear the costs themselves or pass them on to upstream and downstream partners, ultimately reaching consumers. While CPI has not fully reflected this yet, PPI is already very clear. PPI is upstream of CPI, and tariffs' costs will inevitably be passed on to consumers in the coming months, making the end-of-year CPI figures look grim.
These two figures (CPI and PPI) will ultimately influence the metric the Fed is most concerned about—PCE.
PCE determines whether they will lower interest rates. The market originally anticipated a 50 basis point rate cut in September, but the outlook now suggests a maximum of 25 basis points, making a 50 basis point cut impossible.
Another crucial point is that **dollar liquidity has become an issue.** On August 15th, the Fed's overnight reverse repurchase (ONRRP) balance fell to 33.8 billion, the lowest level since 2021. Moreover, the number of counterparties participating in the transactions—institutions that can deposit money here—has been decreasing since July, dropping from 62 to only 13 or 14 this week, also a new low since 2021. Citibank even released a report stating that in two weeks, by the end of August, the overnight reverse repurchase balance could drop to zero. This has alarmed Wall Street because if the RRP hits rock bottom while the Treasury continues to issue bonds and the Fed shrinks its balance sheet, it will directly consume bank reserves. What is an overnight reverse repurchase? In simple terms, it is a 'wealth management account' opened by the Fed for money market funds. When there is excess cash, funds with idle money deposit it in the Fed, which pays them interest. The current interest rate is 4.25%, and it is risk-free. However, recently the Fed has been shrinking its balance sheet while the Treasury is aggressively issuing short-term bonds, draining the funds available. Previously, there were 62 funds depositing money; now there are only 14, with the balance shrinking from a peak of 2.2 trillion to just over 30 billion, leaving almost no funds.
The Fed's main liabilities are three items:
1. Overnight Reverse Repurchase (RRP): There is now only over 30 billion left.
2. Bank Reserve Accounts: This is where banks deposit money in the Fed's account, and the Fed pays interest (4.4%). There is currently 3.33 trillion in it.
3. U.S. Treasury TGA Account: This is the Treasury's 'General Account,' where tax revenue, tariff income, and money from bond issuance all go. Currently, there is about 504 billion. The problem now is that to replenish the TGA, the Treasury has to keep issuing bonds. The RRP money is gone and can only be deducted from bank reserves. The 'safety line' for reserves is 3 trillion. There is currently 3.33 trillion, which looks quite a lot, but it is only 300 billion above the safety line. It should be noted that some Fed governors (like Waller) have said that reserves can even drop to 2.7 trillion without major issues. However, many people are concerned that dropping below 3 trillion is a warning line.
The next critical juncture is September 15th, the deadline for U.S. corporate quarterly tax payments. The tax payments will need to be transferred from the bank reserve accounts to the Treasury's TGA account, expected to amount to 100 billion. The following day, another 30 billion will need to be transferred. Additionally, on September 15th, there will be 80 billion in bond interest that needs to be settled. Just on this day, the reserve account will need to be drained by 200 billion. This could potentially bring reserves below 3 trillion. Furthermore, by the end of September, it might even drop below 2.9 trillion.
This brings to mind the crisis in September 2019. It was also on September 15th when corporate tax payments and bond settlements caused a liquidity chain breakdown in the repo market, and rates skyrocketed from over 2% to 10%. The market completely collapsed, and the Fed had to urgently inject 500 billion that day. So now, the market is worried about a potential repeat.
Barclays recently issued a warning that reserves will fall below 3 trillion in mid-September. They even detailed the calculations: the Treasury's TGA account needs to recover to 850 billion, but currently, it only has 504 billion, so the shortfall will need to be covered by reserves, which will require a withdrawal of about 350 billion. This will bring the reserve account to the 3 trillion red line. However, they also emphasized several buffering factors:
1. The market has already digested 350 billion in bond issuances in August, and interest rates have not surged but have only seen a slight increase.
In late September, the issuance of government bonds will slow down, with the net issuance likely only being over 30 billion.
The cash management bills issued in early July will mature in late September, which can ease the liquidity crunch.
Most importantly, the Federal Reserve has a 'Standing Repo Facility' (SRF), which acts as a last resort. Once the market runs out of money, the Fed can inject 500 billion to stabilize the market. There is also a tool called term repurchase that can supplement liquidity.
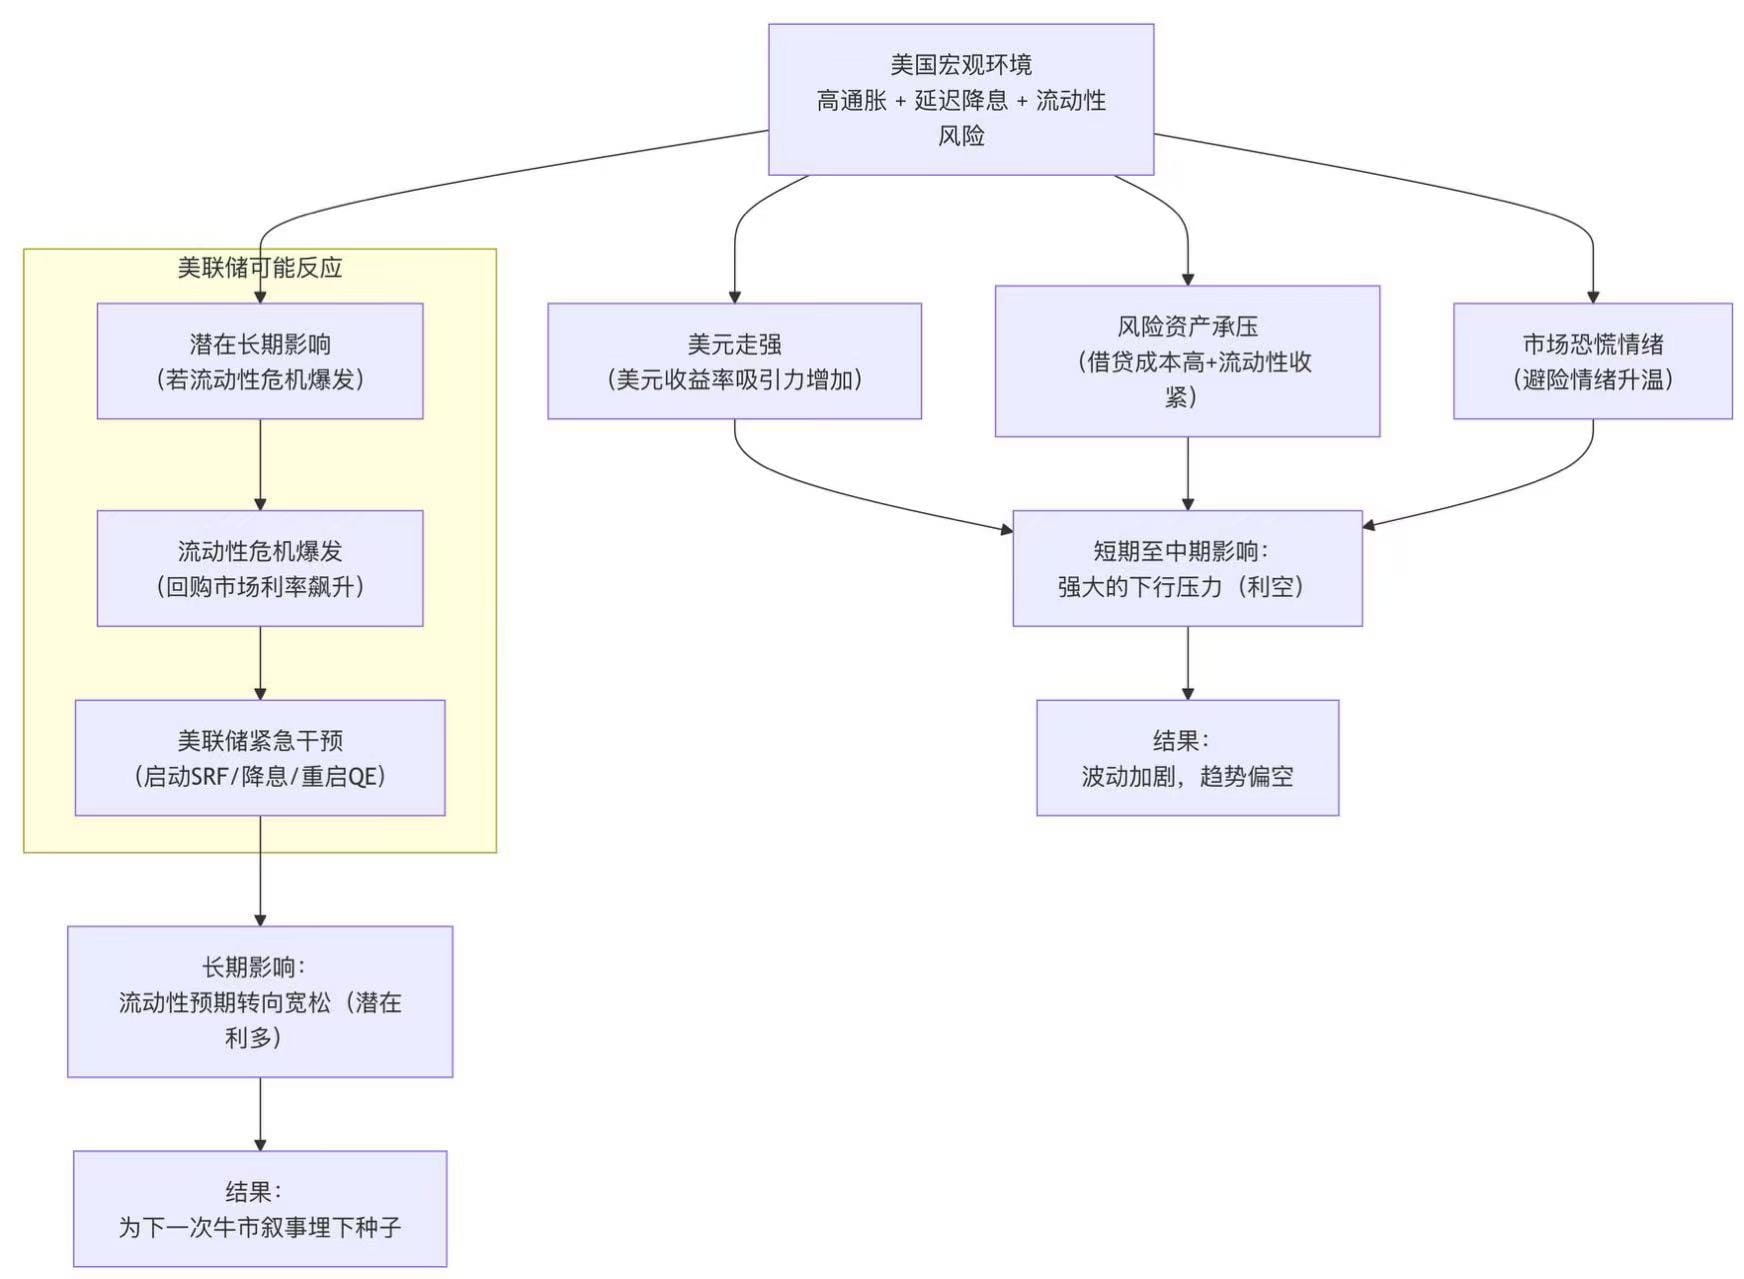
Inflation is stubborn, especially with PPI indicating significant future CPI pressure, forcing the Federal Reserve to keep interest rates high and even delay rate cuts. In traditional financial models, high interest rates reduce the present value of future cash flows. Although most cryptocurrencies do not have cash flows, the market generally views them as long-term growth assets, and their valuation logic is similarly suppressed in a high-interest environment. Risk-free or low-risk assets like U.S. Treasury bonds provide stable returns of 4%-5%. In contrast, cryptocurrencies that do not generate cash flows (most currencies except Bitcoin) face very high opportunity costs. Investors would prefer to hold income-generating assets rather than highly volatile crypto assets. Although Bitcoin is considered 'digital gold,' in the current mainstream market narrative, cryptocurrencies are still widely seen as high-risk, high-beta speculative assets, so market risk-averse sentiment towards liquidity crises will first manifest in risk assets like cryptocurrencies. Increased macroeconomic uncertainty (inflation + potential liquidity crisis) will drive investors away from high-risk assets towards safe-haven assets. A liquidity crisis is actually the best opportunity to enter the market; if a 'money shortage' like in 2019 truly occurs, the market will panic and sell all assets for dollars (including Bitcoin and gold), and there will be a short-term crash. However, the Fed will inevitably be forced to launch tools like the SRF for large-scale liquidity injections. Once the market realizes that the 'Fed Put' is back, the liquidity panic will shift to expectations of a new round of 'easing,' and risk assets may rebound violently. As a liquidity sensor, cryptocurrencies will react more intensely. I have always emphasized that the rise and fall of cryptocurrencies are strongly correlated with market liquidity and negatively correlated with the dollar, so when the dollar strengthens, global risk asset liquidity is drained. Once the market becomes convinced that the Fed's monetary policy will shift from 'anti-inflation' to 'market protection,' expectations of future liquidity flooding will rapidly push up risk asset prices. As one of the most liquidity-sensitive assets, cryptocurrencies may see a violent rise. 'Short-term pain' for 'long-term benefits.' This also confirms the core narrative of cryptocurrencies—that the fiat currency system is fragile and centralized, and central banks will print money without limits in a crisis. This greatly enhances Bitcoin's narrative as 'digital gold' and 'store of value.' If tariffs continue to push up consumer goods prices, leading to entrenched inflation, while traditional financial assets (stocks, bonds) perform poorly due to high interest rates, people will reevaluate Bitcoin's anti-inflation properties seriously. If Bitcoin can demonstrate resilience similar to gold (i.e., maintaining stable or rising prices during high inflation), it will gain significant credibility and may attract a large amount of new institutional investment. Currently, it has not passed this test (Bitcoin plummeted during last year's high inflation), but the next time may be a true test. My personal prediction is that in September, there will probably be medium to high volatility. In the case of a liquidity crisis, if it does not fall significantly, it will be difficult to break out of the trend. In fact, BTC, after the handover between new and old institutions, will increasingly show its resilience. ETH is currently going through the BTC 20k-60k stage, and September is the best opportunity to allocate crypto assets; after the liquidity crisis, it will continue to rise until 2026.