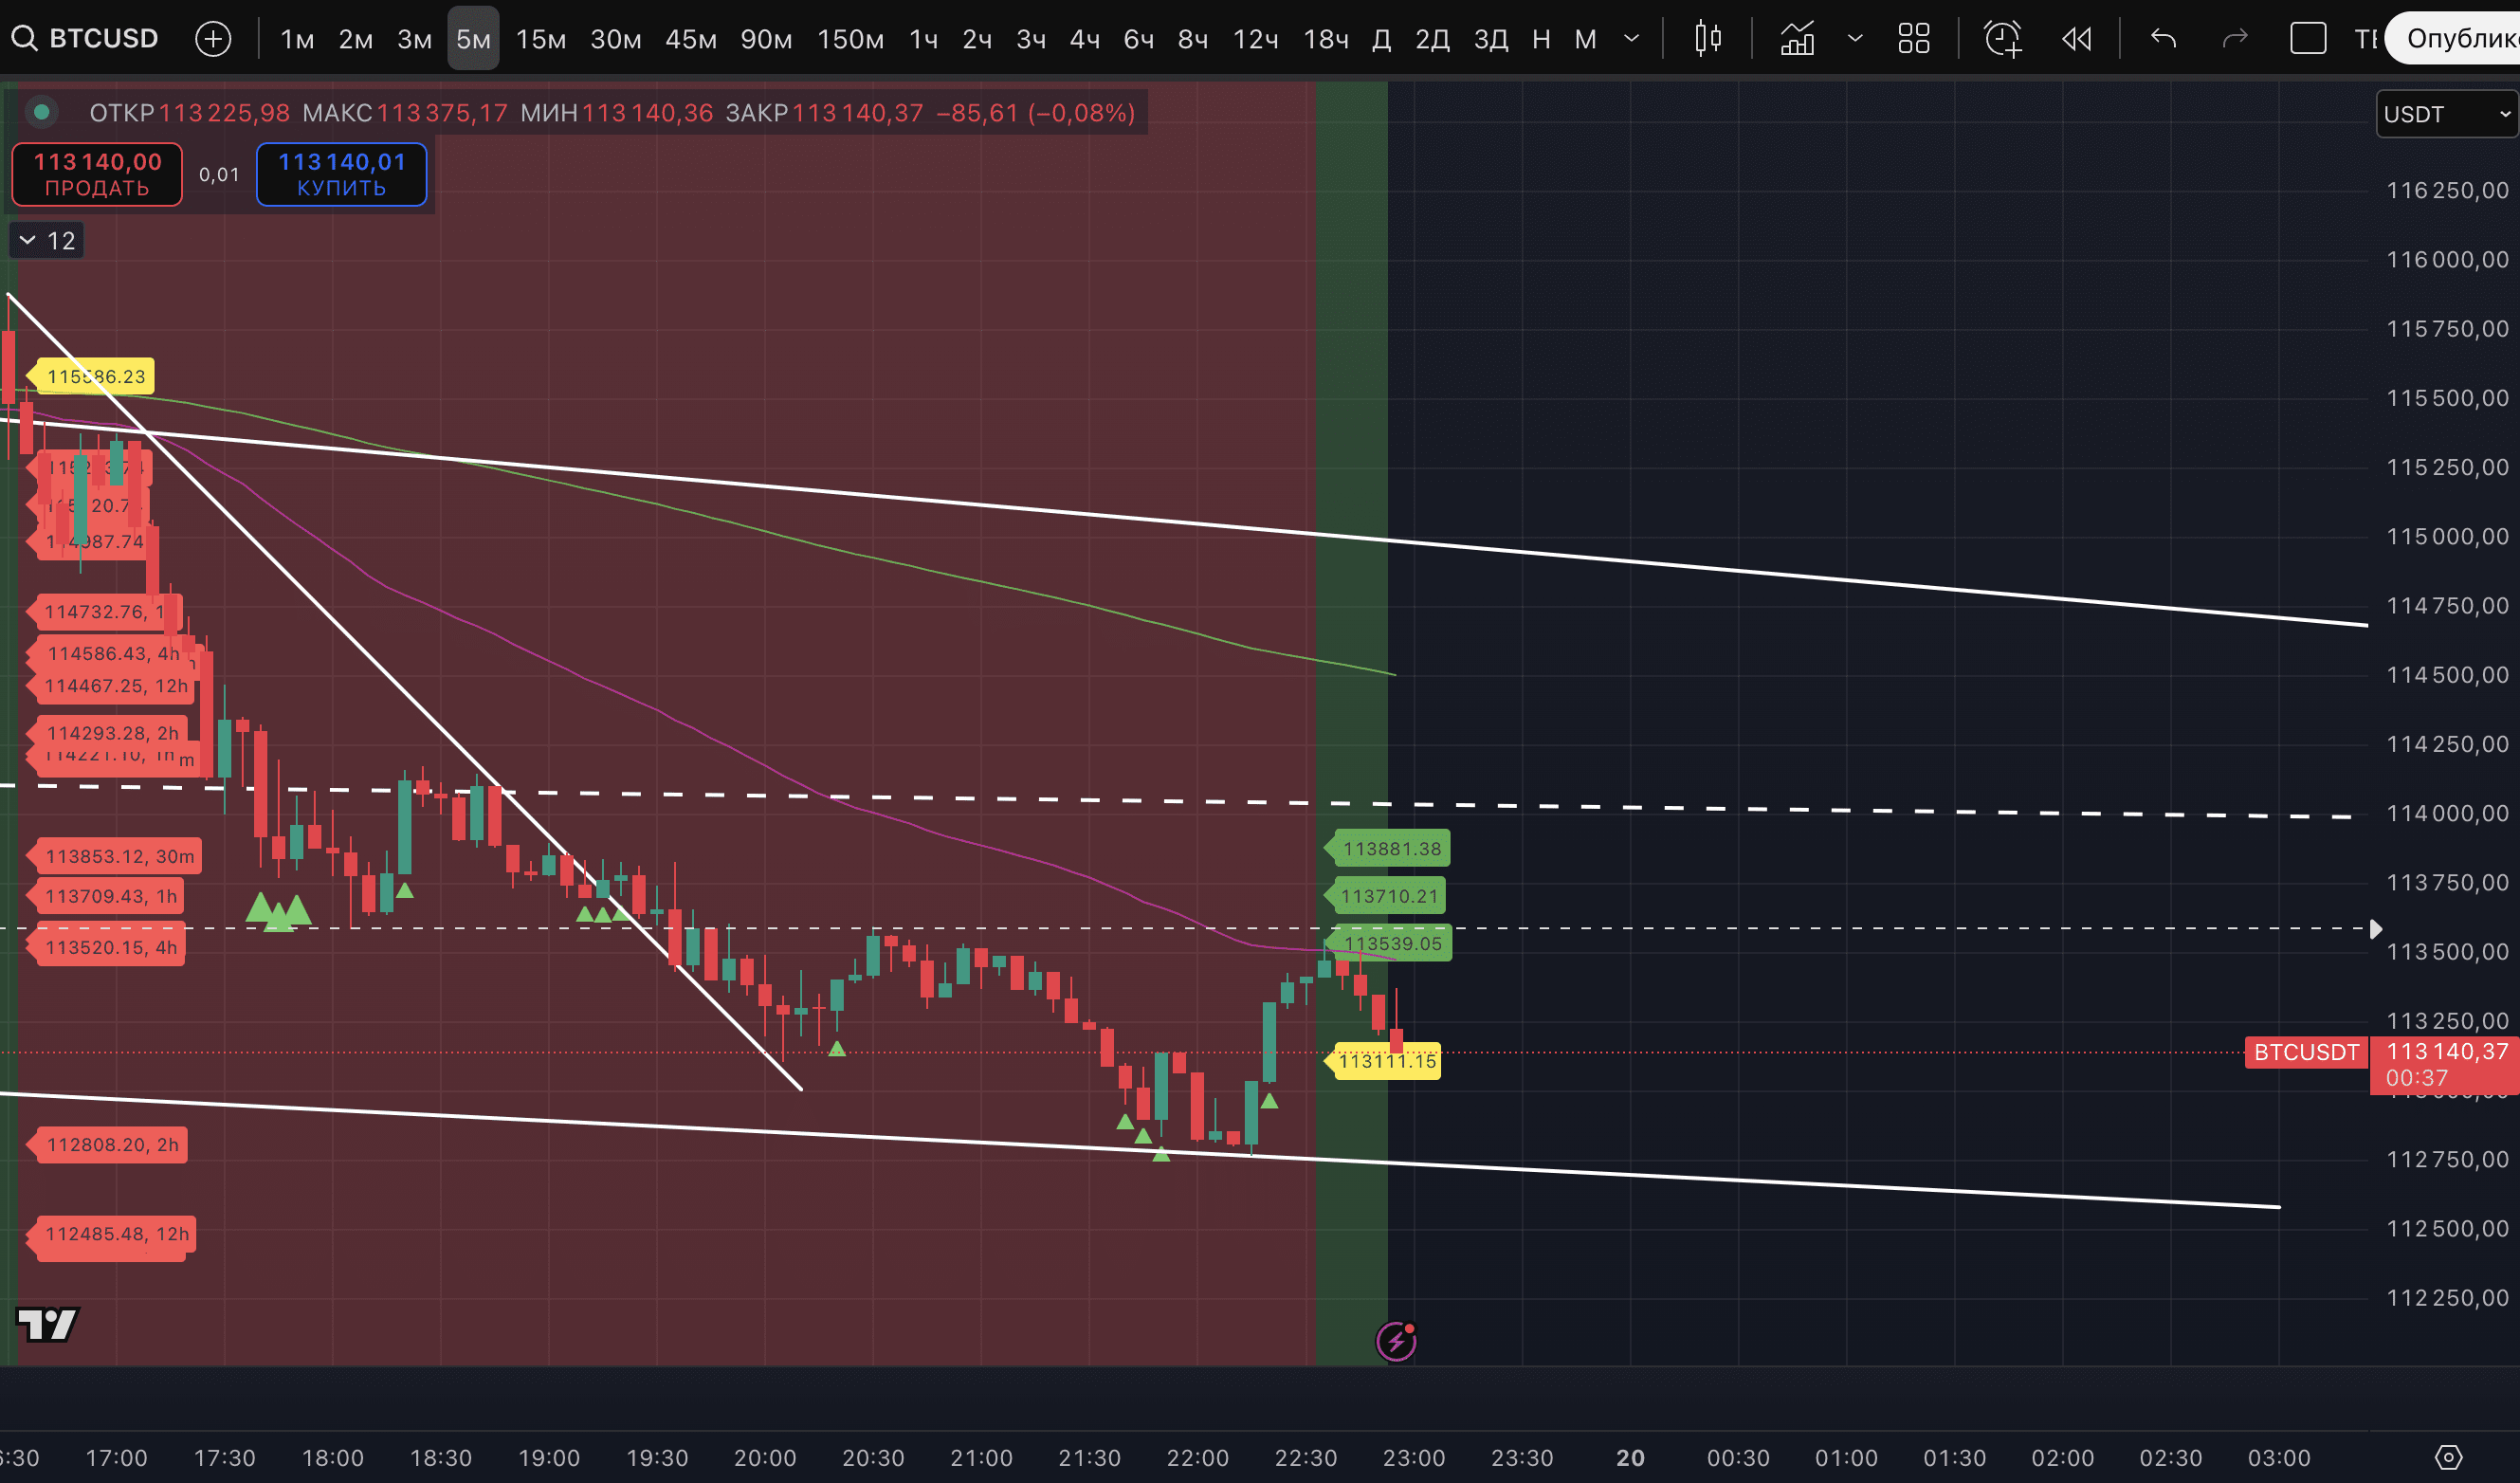
The BTC rate shows the first attempt at a reversal, a stable uptrend on the 5-minute TF.
Before this, as seen, the downtrend on the 5-minute TF lasted for 6 hours and during this time 14 out of 16 targets were reached according to our indicator.
There is currently little faith in the current attempt at a reversal because:
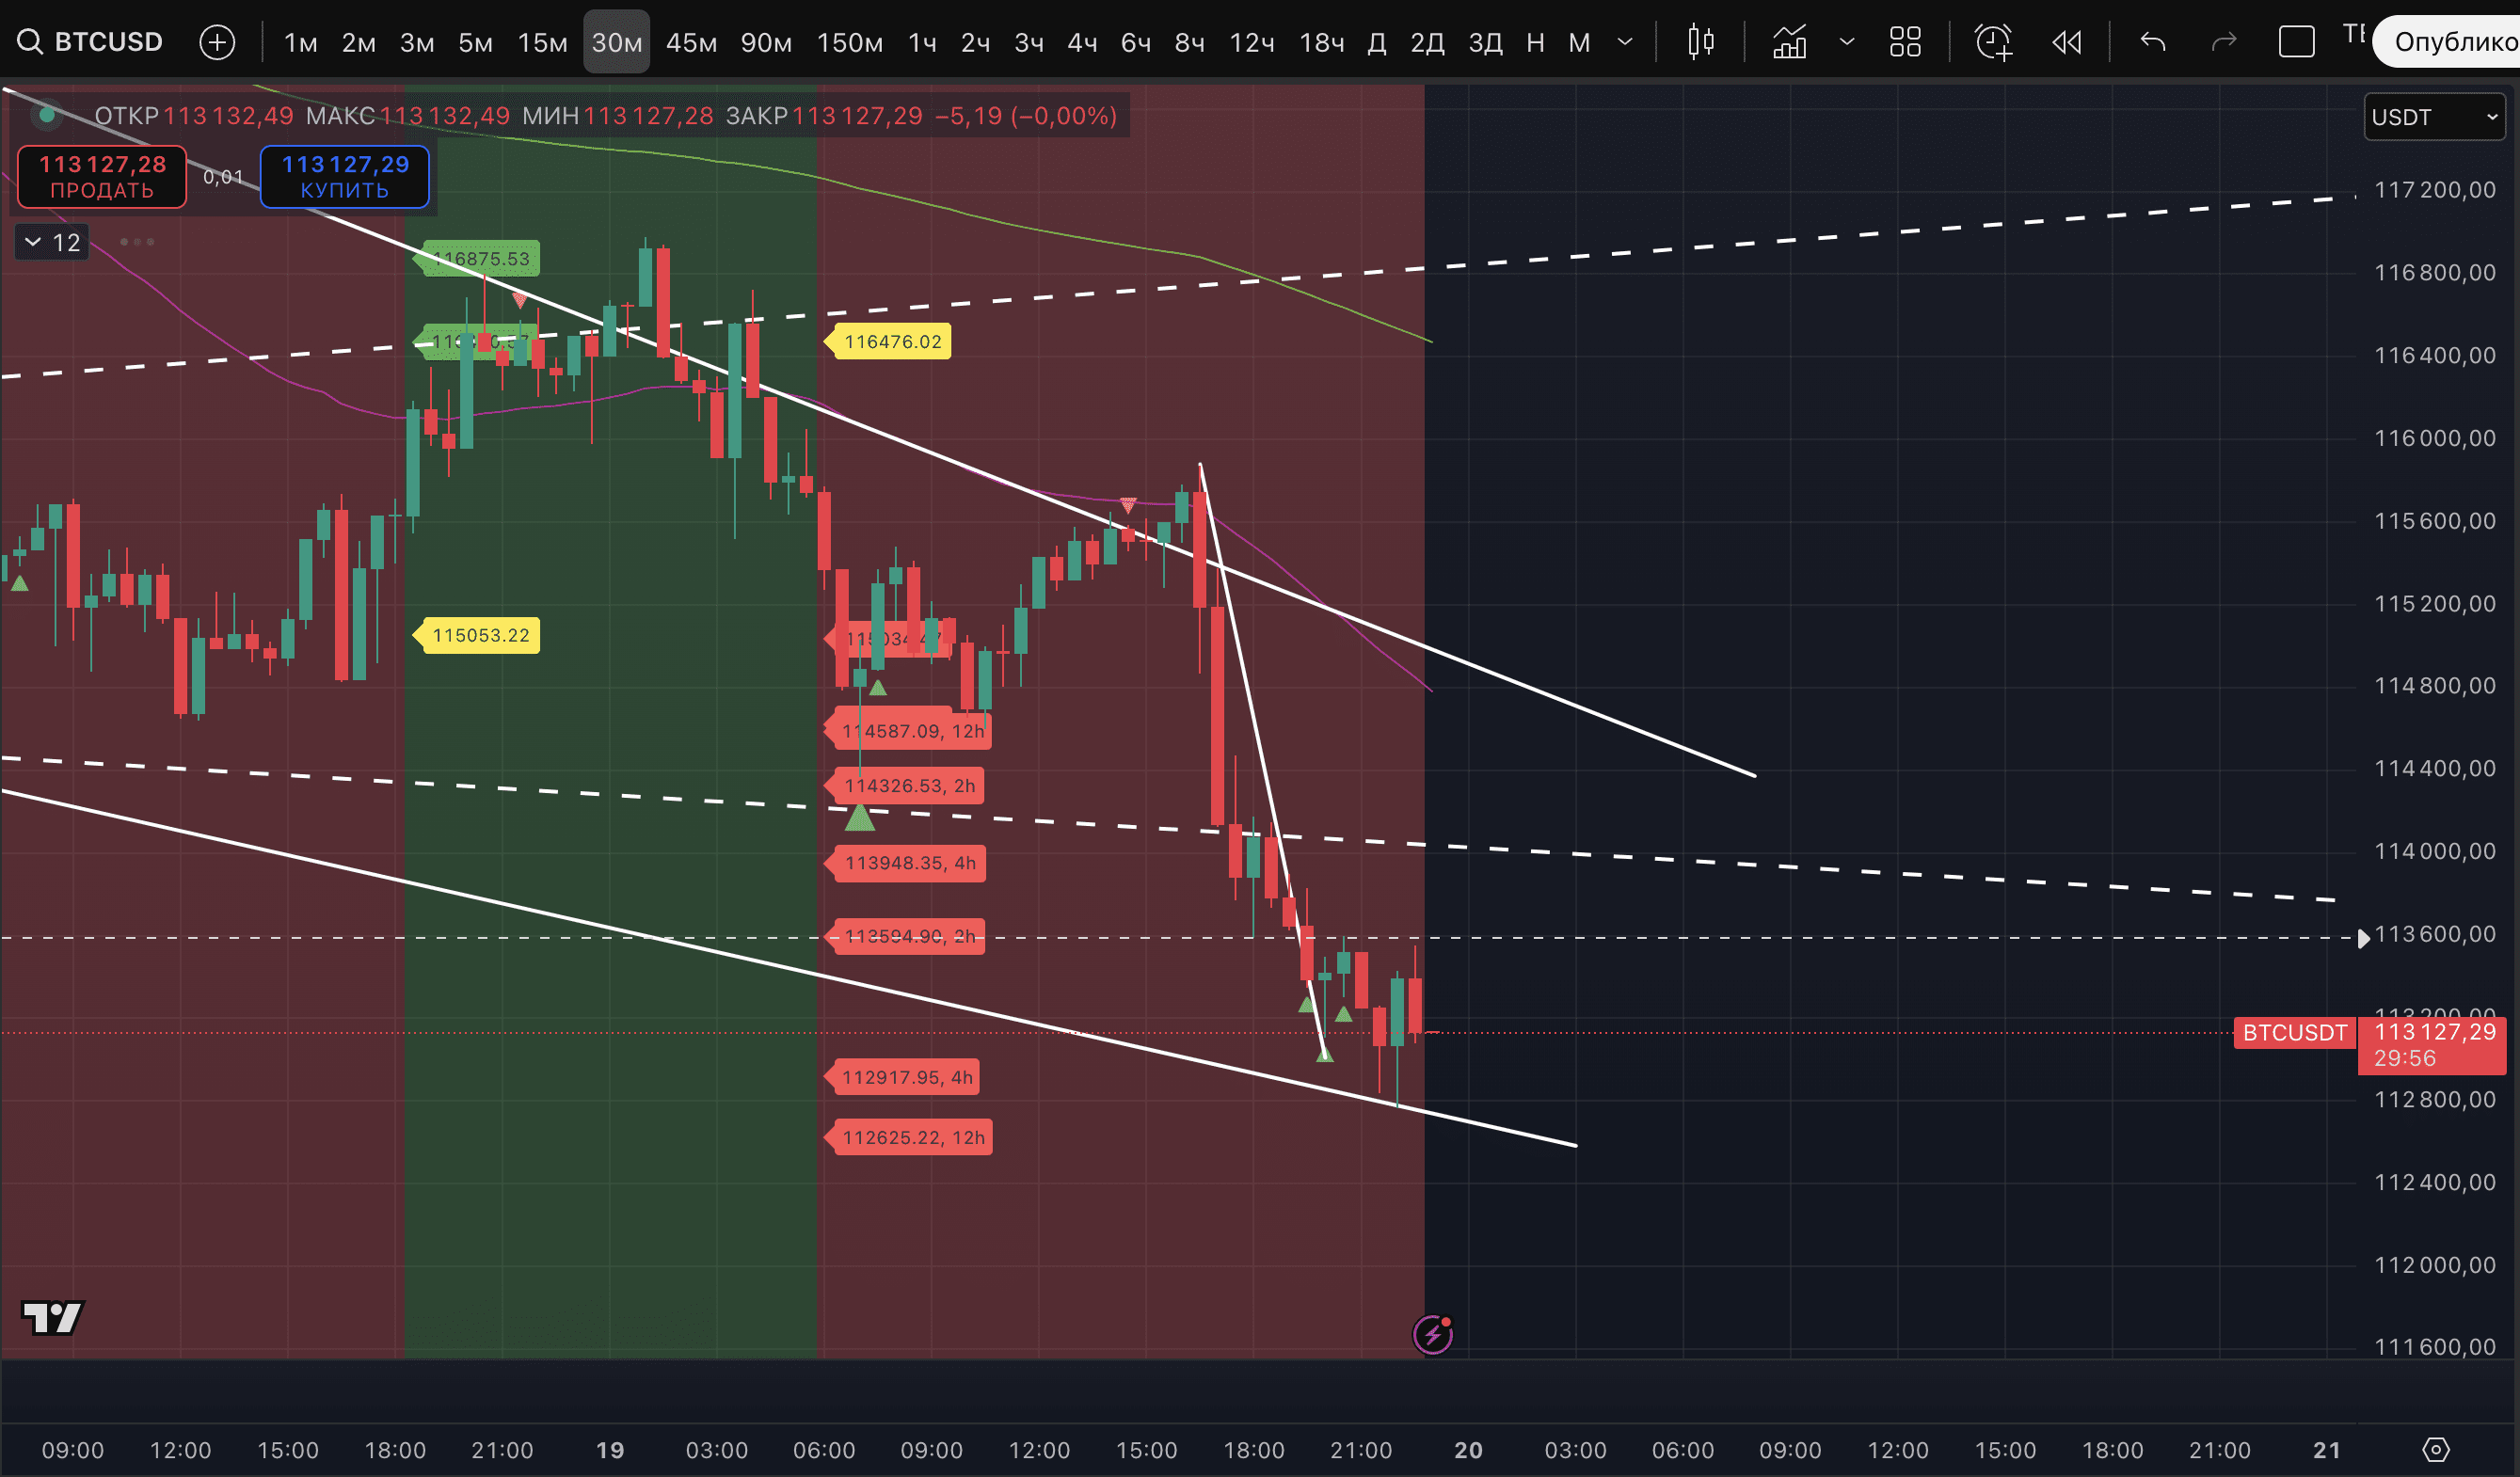
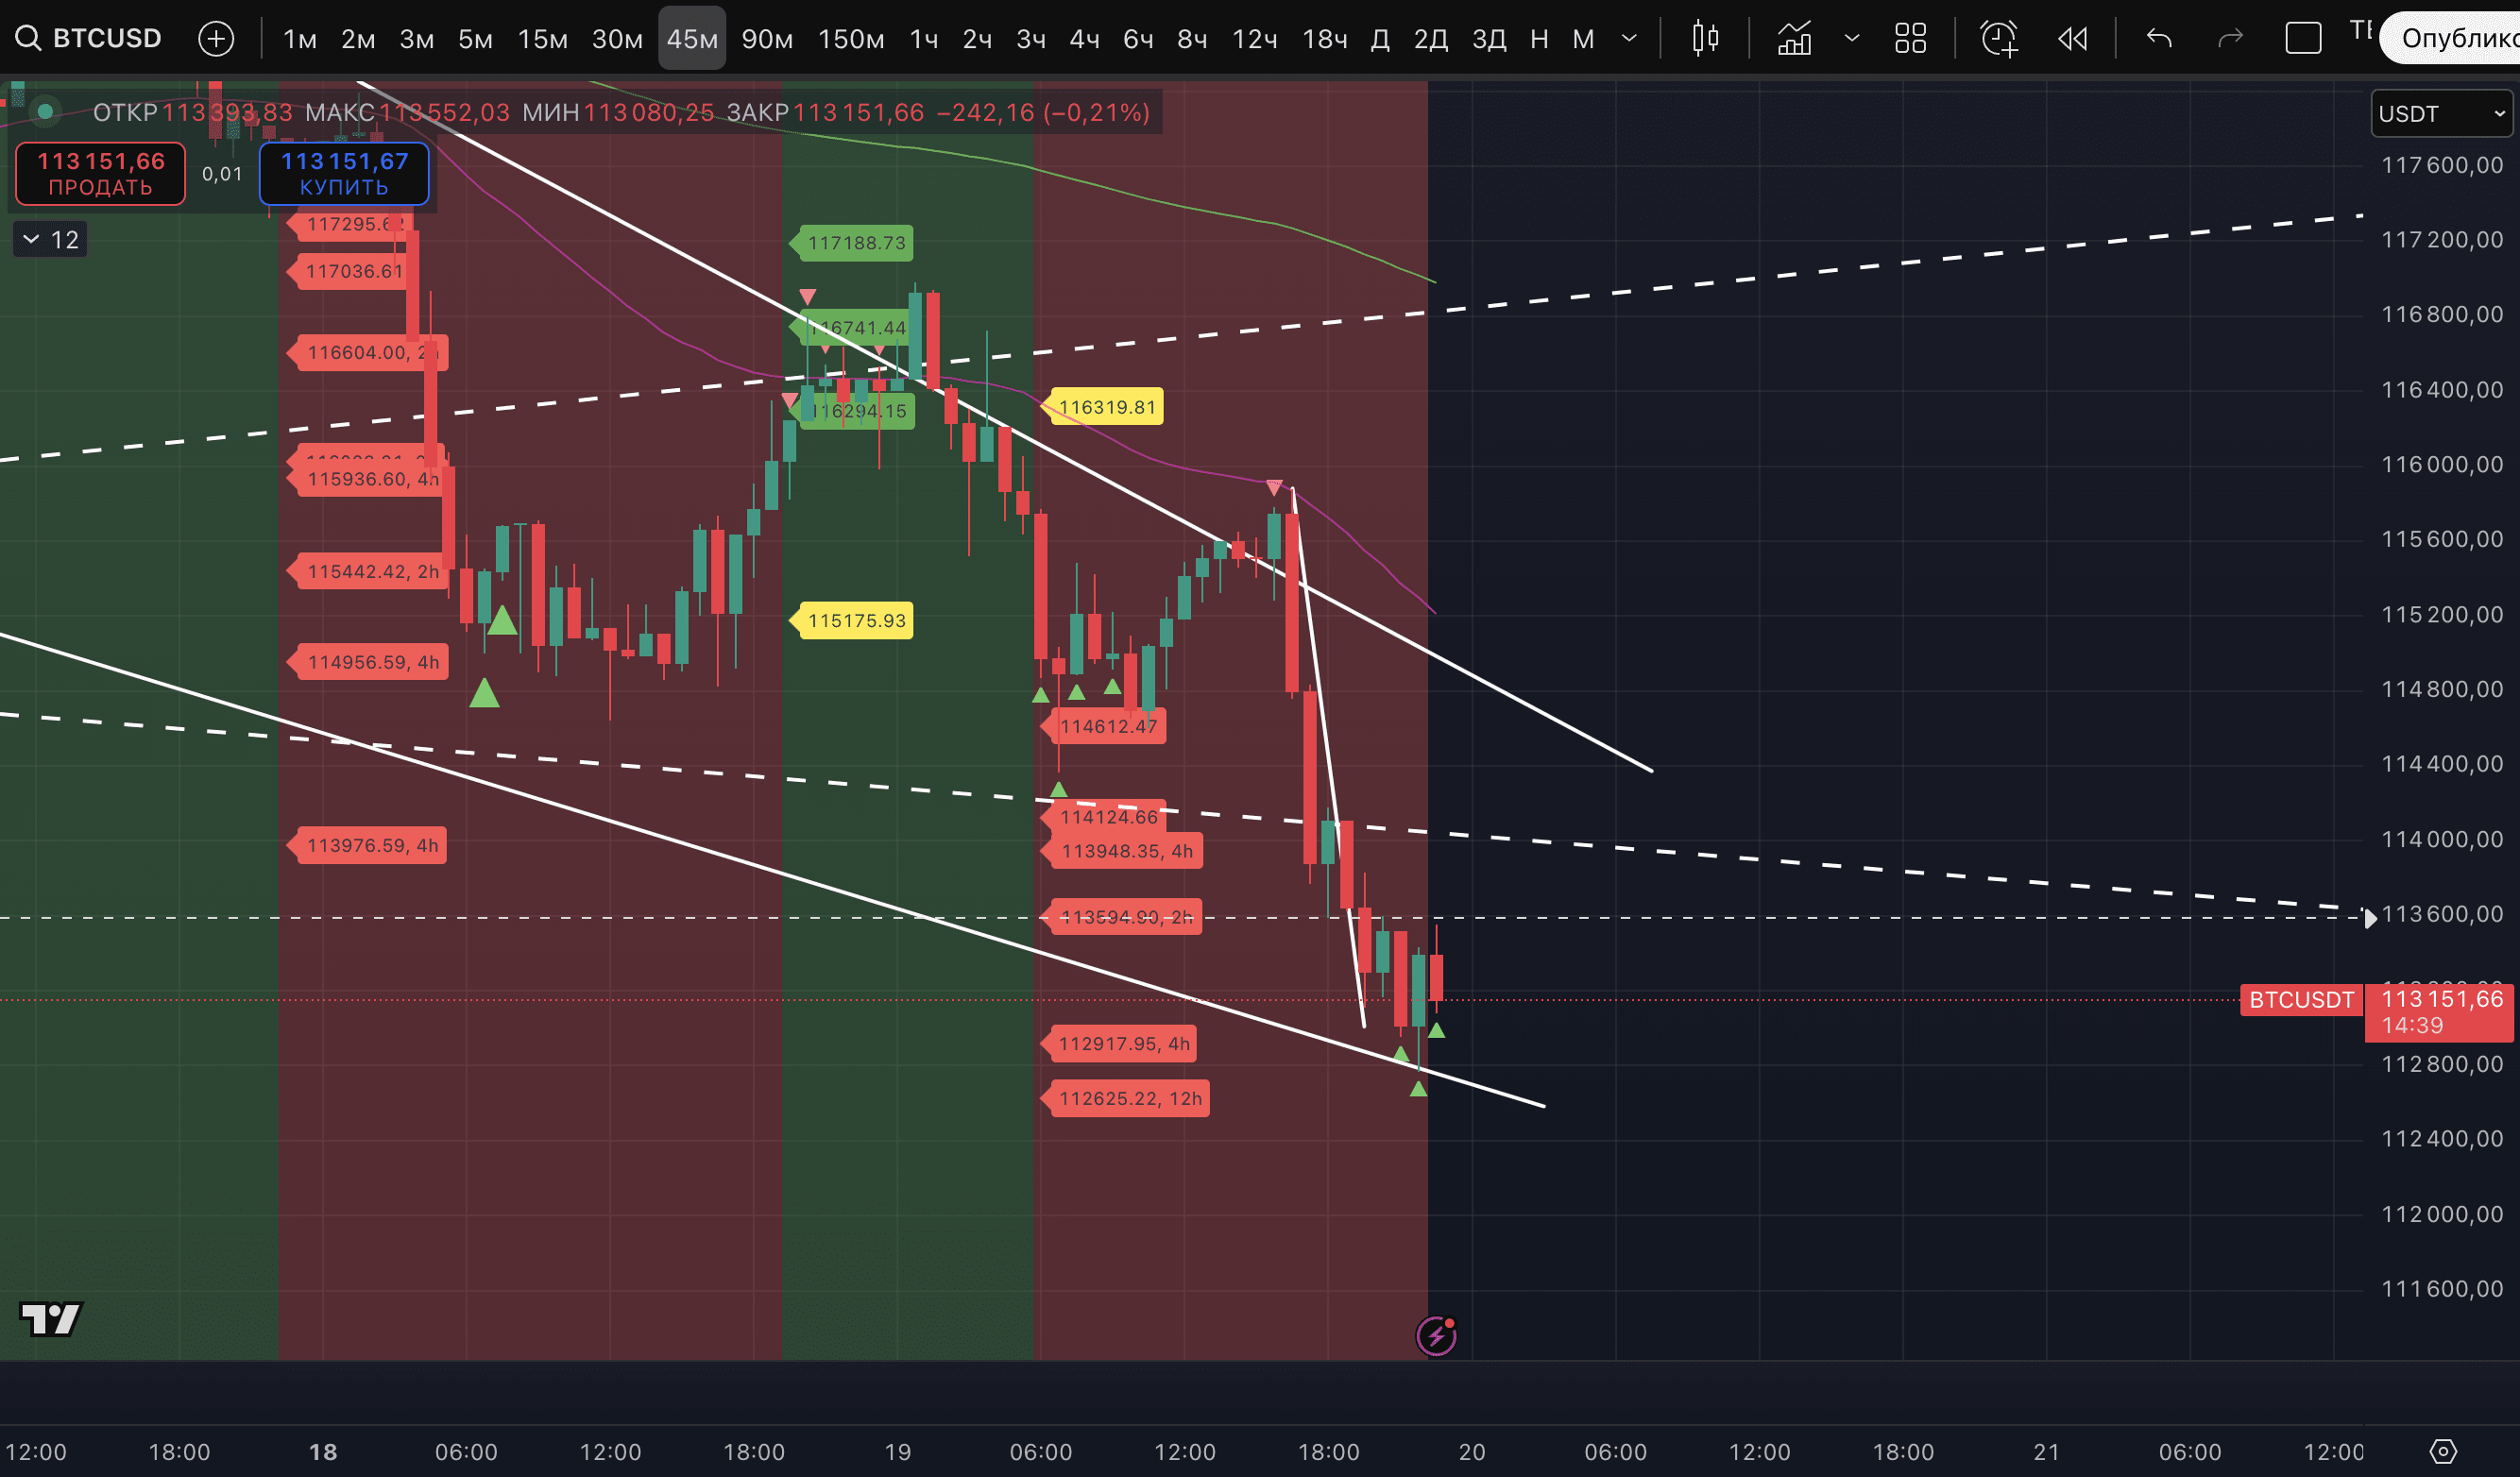
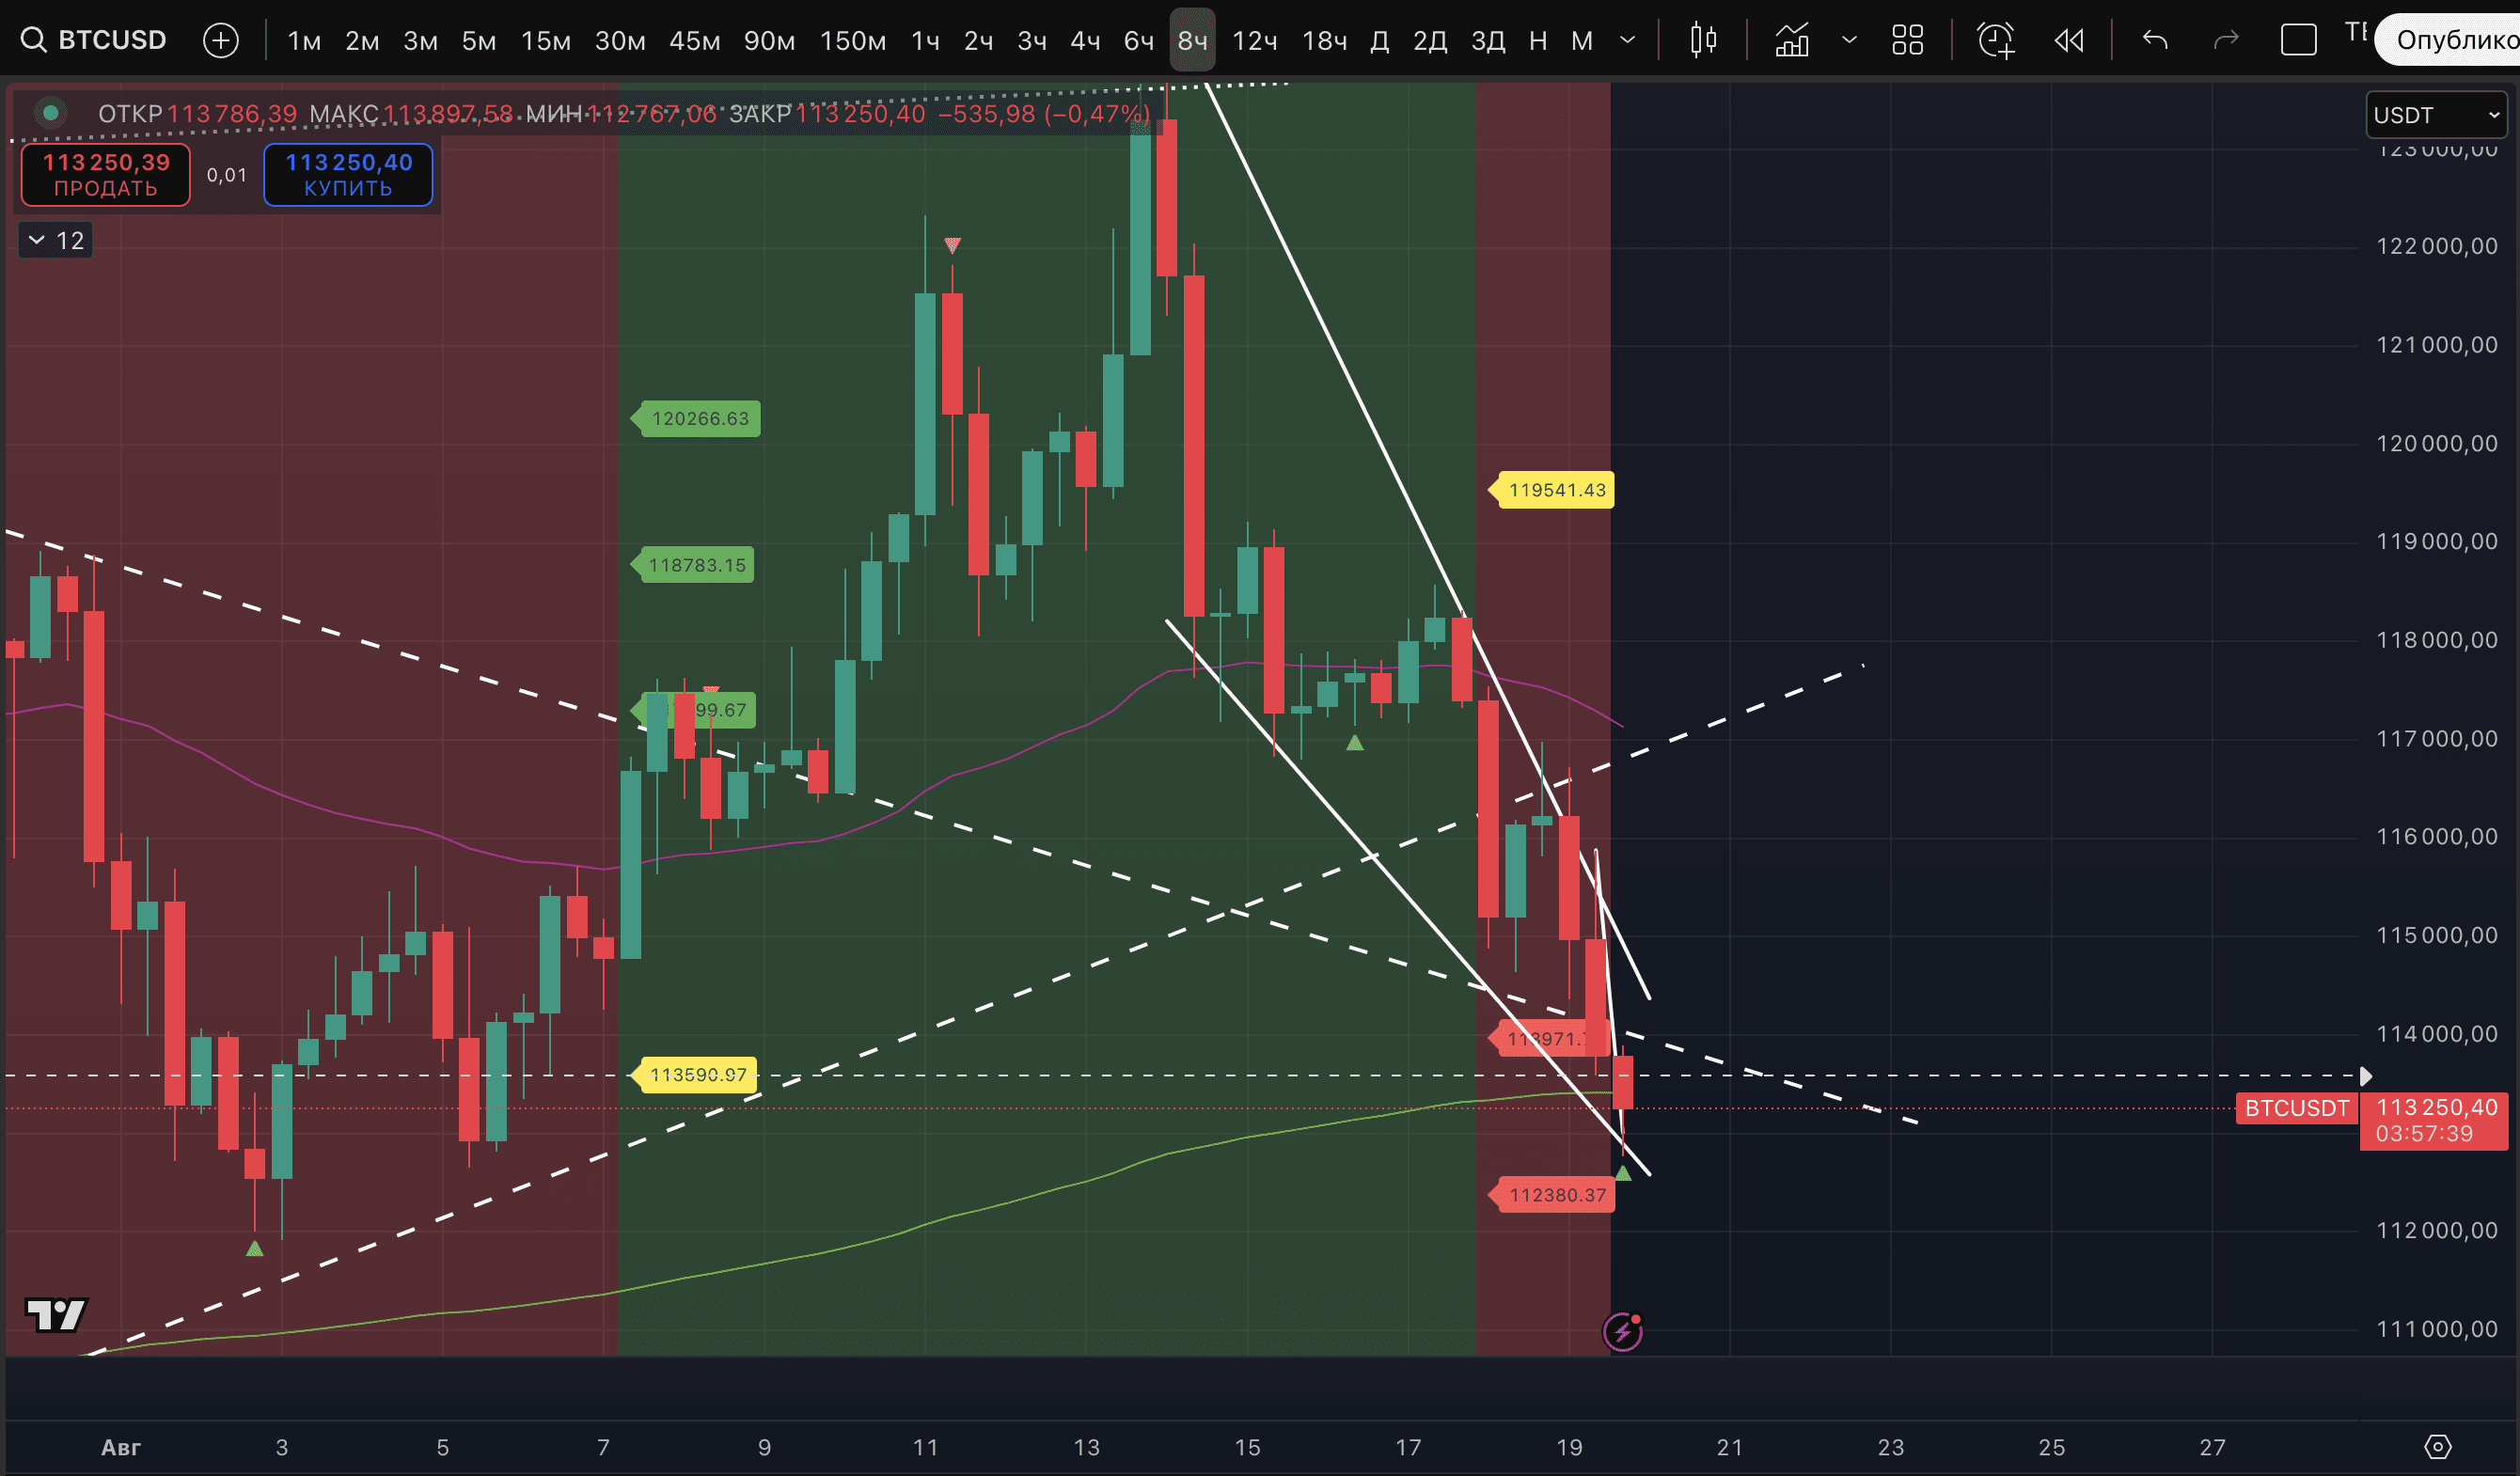
1. There is no consensus on the labels of potential highs on different TFs. There are labels on the 30-minute TF (and they were broken), there are some on the 45-minute TF. There are two labels on the hourly TF. There is one label on the 8-hour TF. With such pressure from sellers - not the best combination. Moreover, there are no Strong signal labels at all.
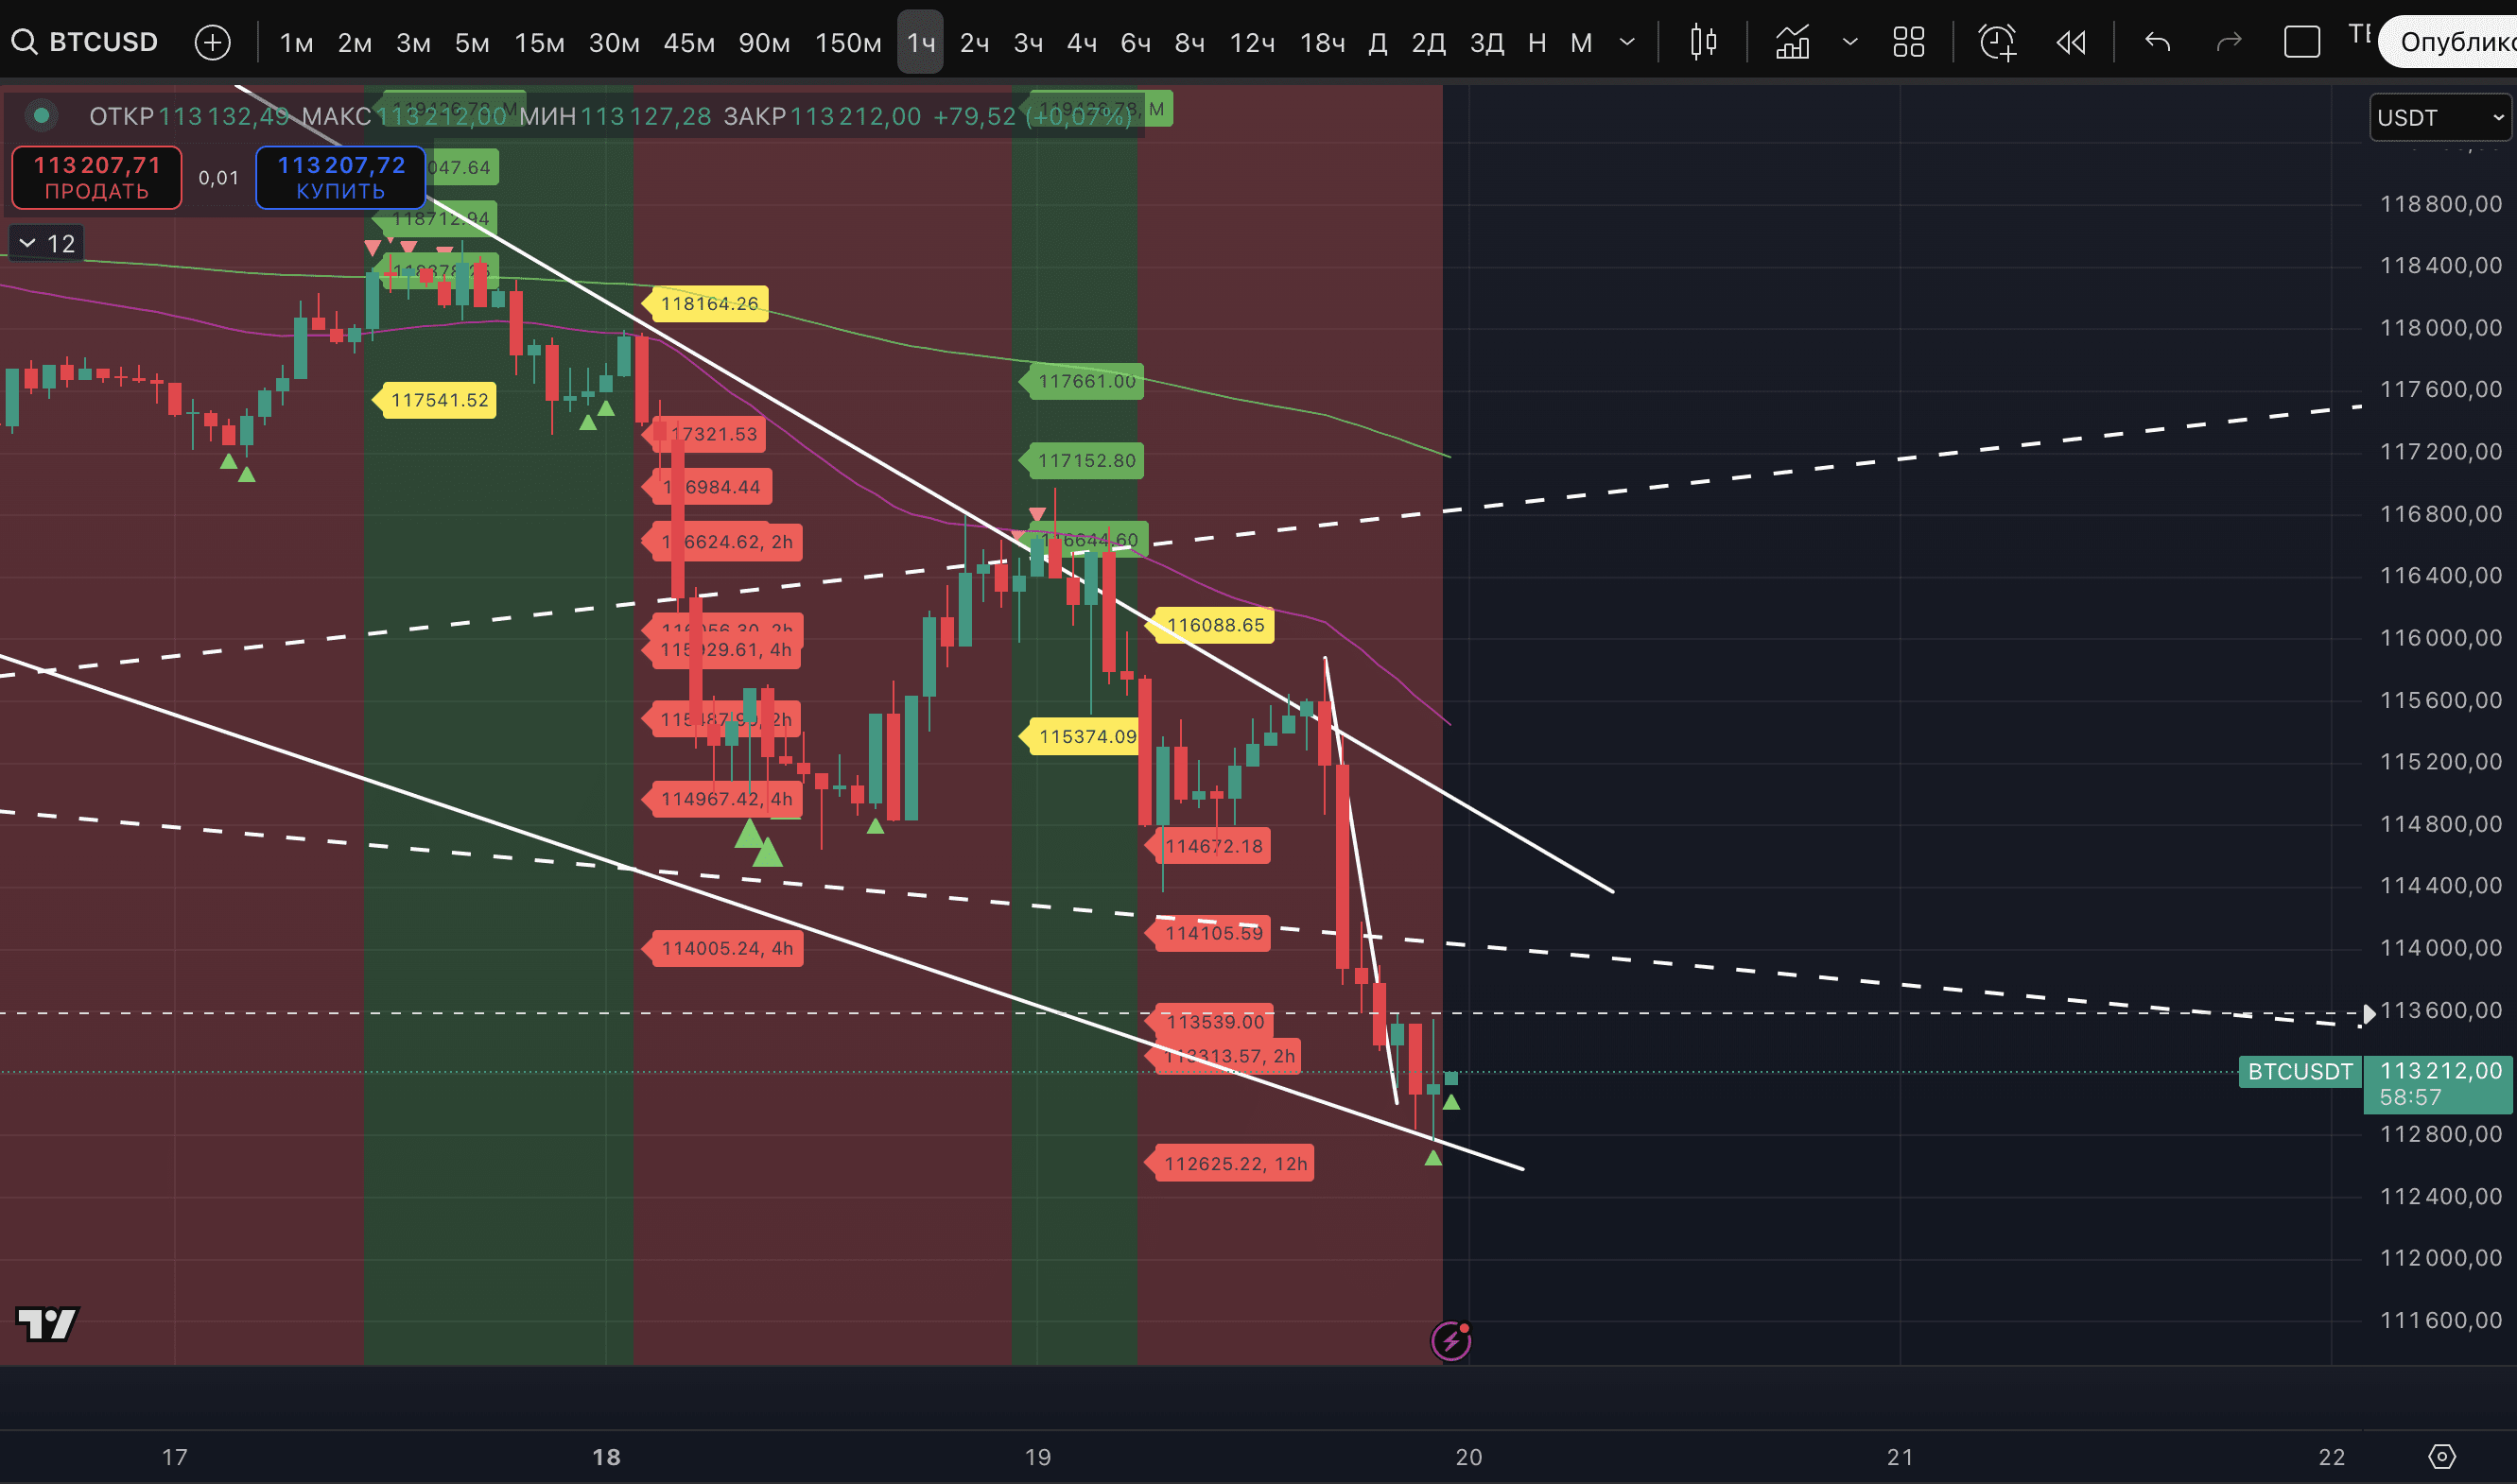
2. After the transition to an uptrend on the 5-minute TF, there is a pronounced reaction from sellers at the EMA 50. The fact that even such a moving average is not broken indicates little faith in the authenticity of the uptrend.
3. There was no final expressive breakout. As an option - with the update of the low on August 3 at $111,920 and the removal of liquidity behind it.
Let's see what happens in the next two hours, time to look at the hourly TF labels, to analyze the situation with stable trends on TFs longer than 5 minutes.
We fully admit that there might be a climax of sales nearby, but the situation could be spoiled by the price transitioning into a stable downtrend on the daily TF. We will only know this in 4 hours. For now, the situation on the daily TF looks not very favorable for bulls, especially due to the breakout of the EMA 50, which is currently quite far from the current price at $114,965.
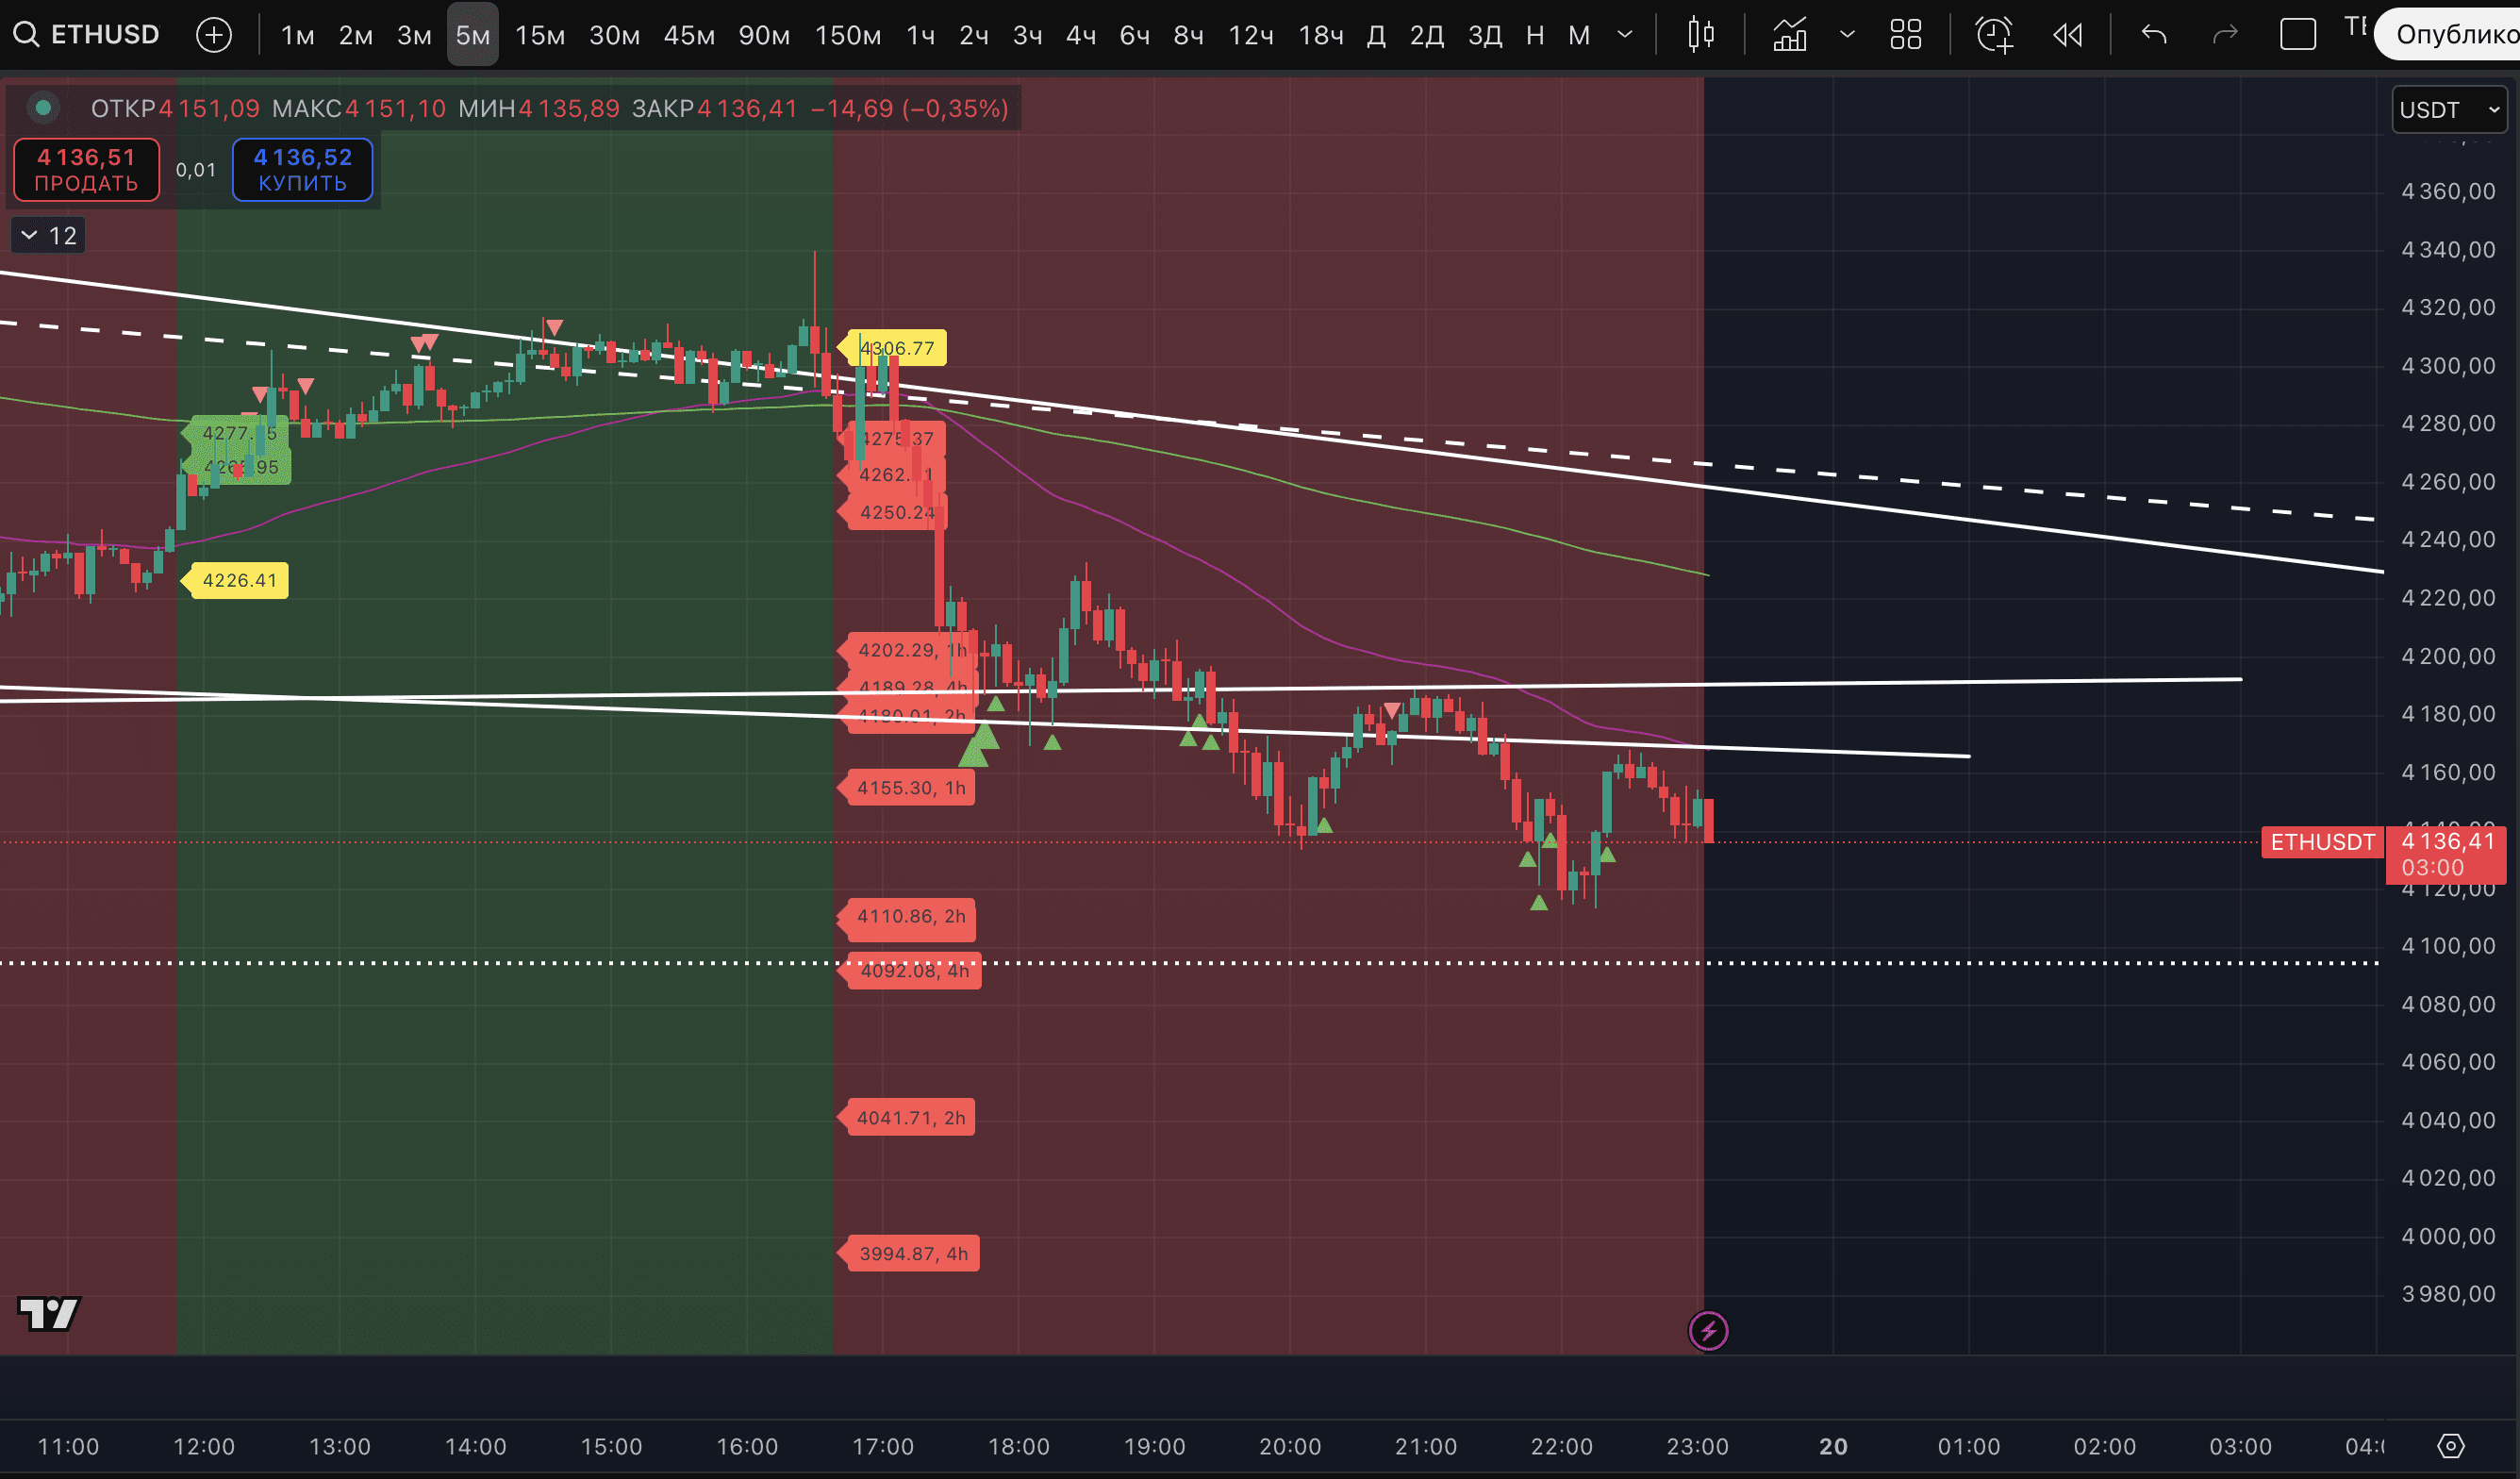
By the way, #ETH did not transition to an uptrend on the 5-minute TF. So specifically here and now regarding stable trends - weaker than #BTC.