
Bitcoin (BTC) is hovering around $115,650 after falling into a downtrend channel. It is now touching the lower boundary of the channel at $114,400, which is a critical level that needs to be held. This decline has raised questions about whether it is a sign of general market weakness or merely profit-taking from investors who have been riding the highs.
Political news also affects sentiment. U.S. President Donald Trump announced a trilateral meeting with Russian President Putin and Ukrainian President Zelensky to discuss security guarantees for Ukraine.
Although details are unclear, the proposal includes joint aerial and naval patrols as well as intelligence sharing. If progress is made toward ending the war, it could ease global risk-off sentiment and provide indirect support for risk assets like Bitcoin.
Long-term holders are confident.
Despite the short-term drop, institutional buyers have not sold off. Treasury firms Metaplanet and Strategy purchased 1,185 BTC this week, believing in Bitcoin's long-term value. Share prices of related companies have also risen, reflecting corporate adoption.
QCP Capital's market analysts note that implied volatility is low, and traders expect Bitcoin to remain within a range. Currently, buying is occurring at $112,000 and selling at $120,000.
CryptoQuant data shows that long-term holders are taking profits, but at a slower pace than in 2017, 2018-2019, and 2022-2023. This indicates a more cautious market, with sell pressure being manageable.
Key takeaways for investors:
Institutional activity: Treasury firms are still accumulating.
Market positioning: Traders are cautious, with low volatility.
Profit-taking: Long-term holders are taking some profits, but not aggressively.
Technical outlook: Bitcoin is at a crossroads.
Technically, Bitcoin is at a make-or-break moment. The price was rejected at $121,950, where a shooting star candle formed a potential top. The subsequent three black crows confirm bearish momentum. However, the recent doji and spinning top indicate that sellers are losing momentum.
Momentum indicators add subtlety. The RSI is at 40, which is in the oversold region, allowing for a rebound. Meanwhile, the MACD histogram is flattening, and downward pressure is easing. The $118,406 50-day moving average is the main obstacle for any rebound.
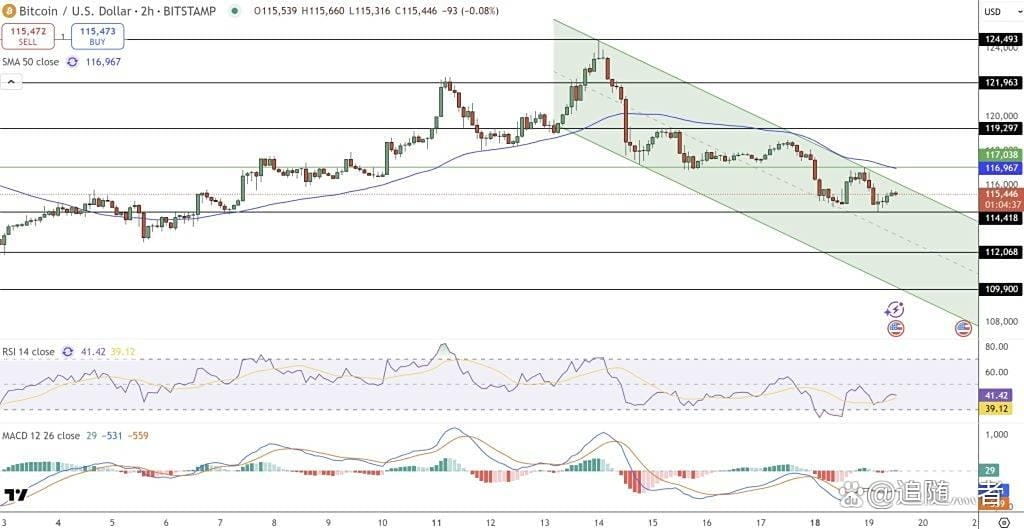
As long as Bitcoin stays above $114,400, the uptrend remains intact. A bullish engulfing candle above $117,000 could trigger a rise to $118,400 and $119,300, followed by $121,950. However, if support fails, Bitcoin could drop to $112,000 or $109,900.
Trade setup:
Bullish: Close above $117,000, target price $118,400-$119,300, stop loss at $114,200.
Bearish: Short if it breaks below $114,400, target $112,000, stop loss at $116,000.
In short, Bitcoin's next move depends on whether the bulls can hold the support area at $114,400. Traders should wait for candle confirmation before entering positions, with momentum balanced between rebounds and corrections.

