25/08/19 BTC box bottom support, ETH continues in a descending channel, where will the next rebound opportunity be?
After Bitcoin hit a historical high, it has fallen for six days due to a false breakout, currently touching the bottom of the range around 114000, where there will be short-term support. The 4-hour chart has shown a descending wedge, so we focus on the height of this rebound, with pressure at 118600 and key support continuing downward around 112000. This level cannot be broken by a large bearish candle; if it breaks, the risk of a further pullback will be greater.
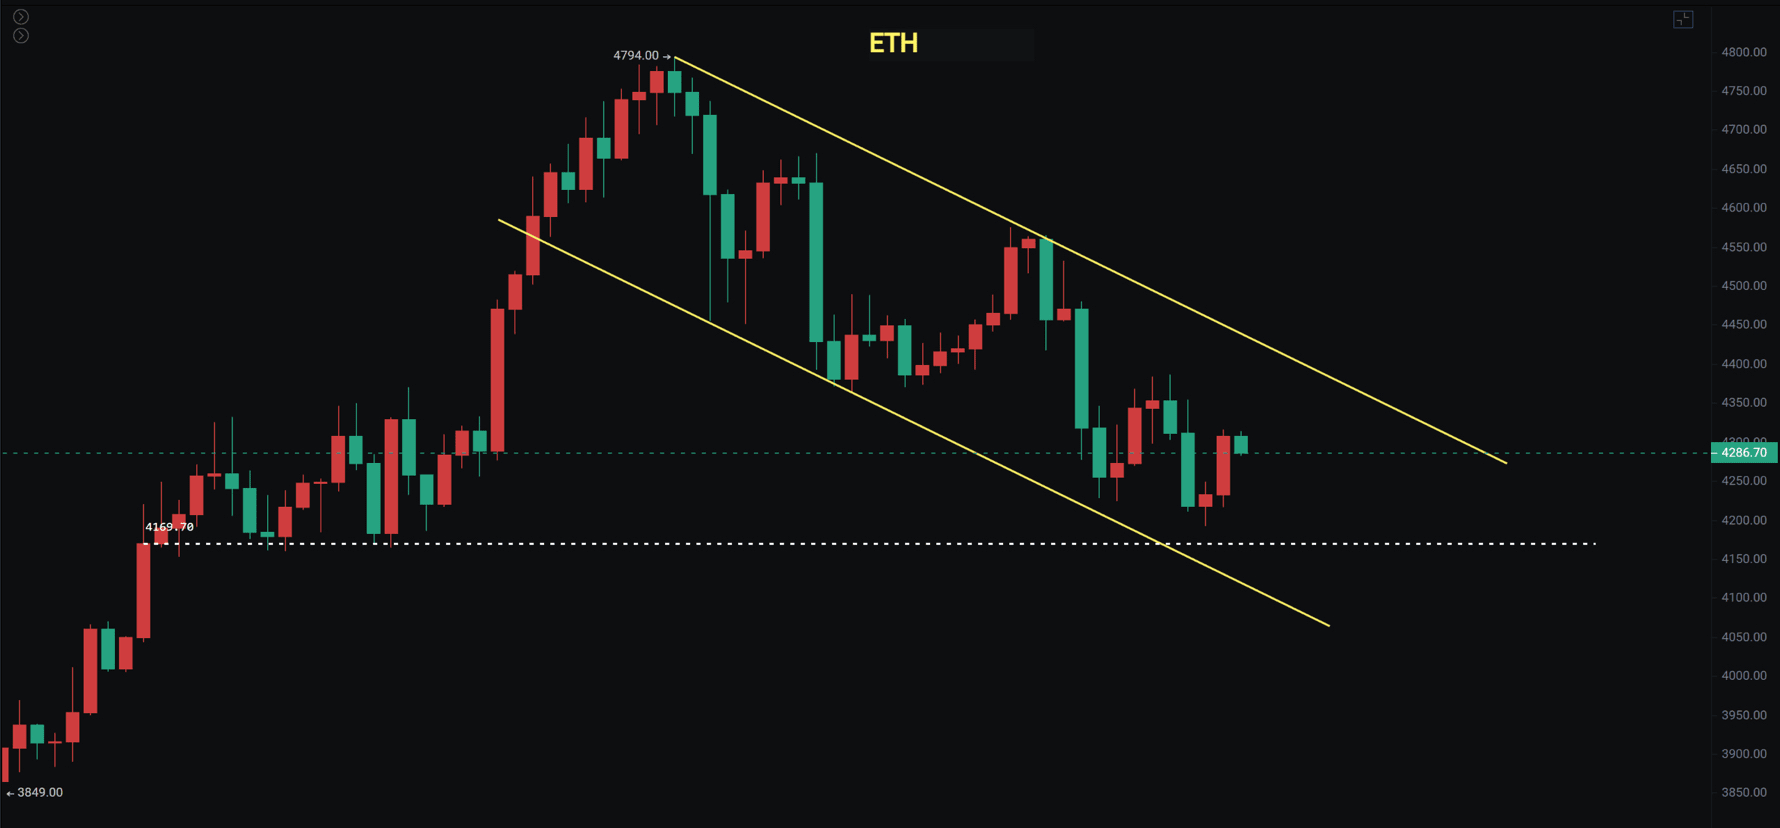
Ethereum dropped from 4788 to 4193, which is also the bottom of the previous fluctuation platform. We will first look at the support in this area. If it continues to break down, we need to consider support around 3800 to 3950. The 4-hour chart maintains the descending channel; we need to pay attention to changes in the channel, and only a breakout can justify going long.
The Nasdaq and S&P 500 are experiencing short-term fluctuations and pullbacks, and have not completely broken the previous high points. We need to pay attention to whether they will fall back down; if they do, a wide range of fluctuations is anticipated, with a possible rebound around August 1. This could also influence Bitcoin's movement. The Dow Jones just showed a slight breakout but has fallen back, creating a very tangled situation.
Bitcoin
Bitcoin has been in a downtrend for six days, and the daily rising trend has been broken, also retesting the previous box bottom support around 114000. If this support continues to break, it will test the neck support around 112000. The previous reminder was that 112000 is a very critical support for the bulls; if it breaks, the adjustment period of the bull market will be prolonged, and long-term positions will need to be reduced.
The 4-hour chart has shown a descending wedge, so we focus on whether it can break out and return to the daily rising trend line for continuation. The probability of interest rate cuts in September has decreased to 83%, but the overall probability of rate cuts remains high.
Support: 112000 to 114000
Resistance: 118600 to 121000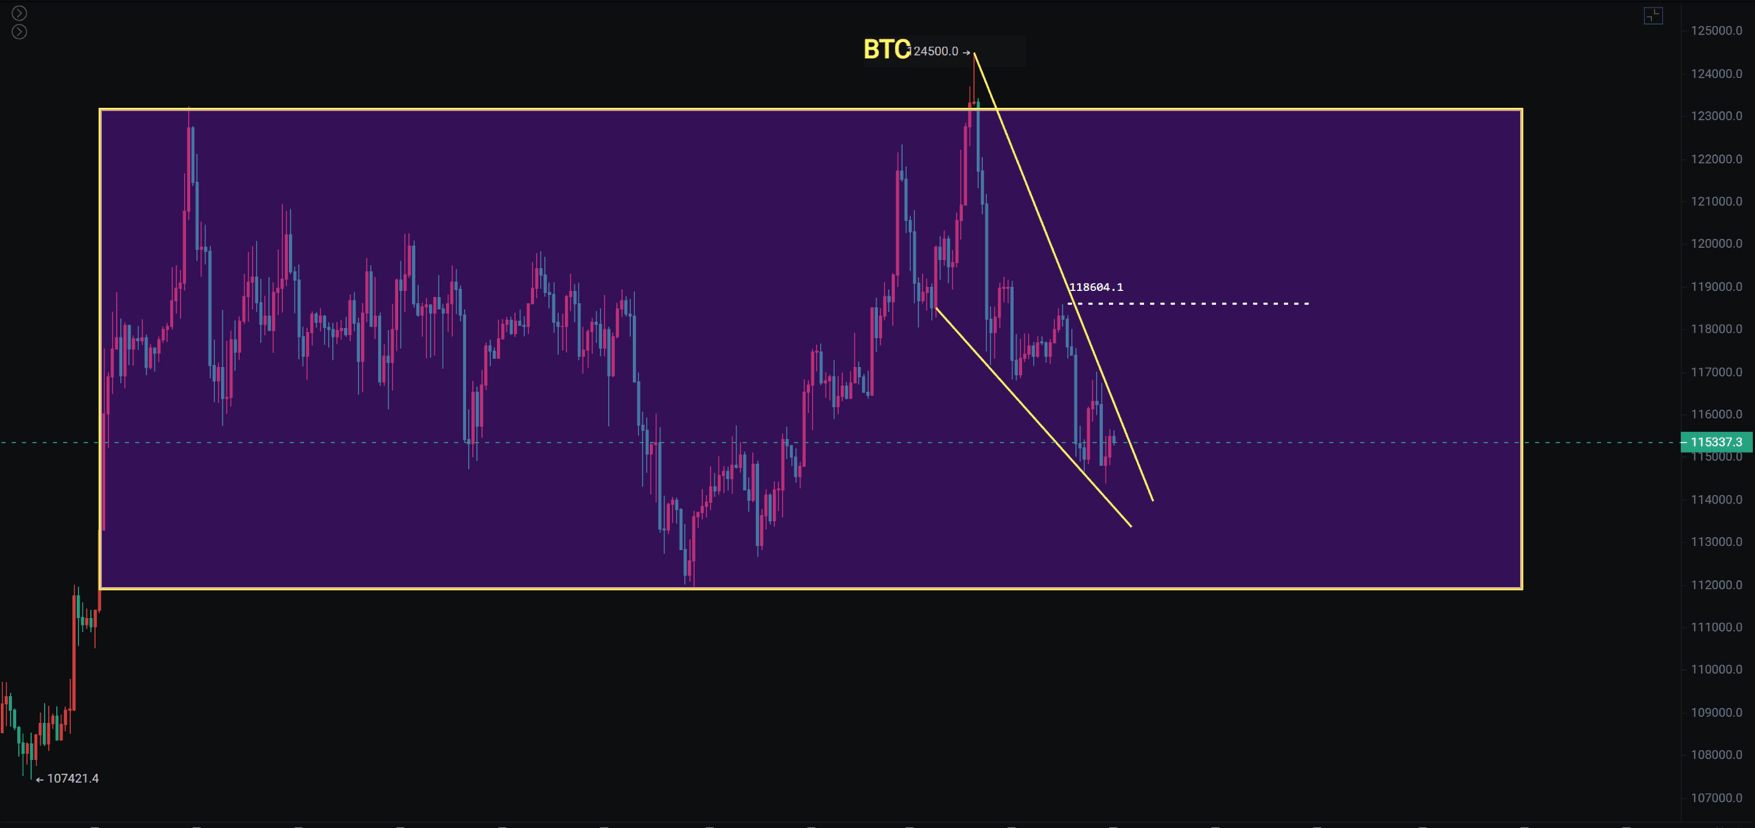
Ethereum
Ethereum has risen from 1385 to 4788, an increase of nearly 2.5 times. The current pullback still belongs to a weak correction; the entire segment has not yet broken 0.236, which is around 3980. As long as it stays above 3800 to 3900, we will still look for a rebound after the pullback.
The 4-hour chart has shown a descending channel, and the current rebound is still weak. However, it has also fallen to the first support level around 4160. We will first see if there is a rebound in this area. The strategy for Ethereum remains that pullbacks are opportunities to accumulate positions gradually. In the second half of the year, Ethereum and altcoins are expected to perform well.
Support: 3800 to 3950
Resistance: 4400 to 4670 to 4788