$ETH has been following expectations in its WXY corrective structure on the short-term chart. Let’s dive into the Elliott Wave setup, support levels, and liquidation heatmap data to see where the market could be heading next.
🔹 Current Elliott Wave Structure
Ethereum’s recent pullback is unfolding within a well-defined downward price channel. The correction is marked by overlapping structures, typical of a WXY pattern, rather than a strong impulsive move.
Wave W and X appear complete.
The ongoing Y-wave is taking shape as an ABC correction, with the final C-wave potentially finishing soon.
A break above the upper boundary of the channel would be the first confirmation that a bottom is in.
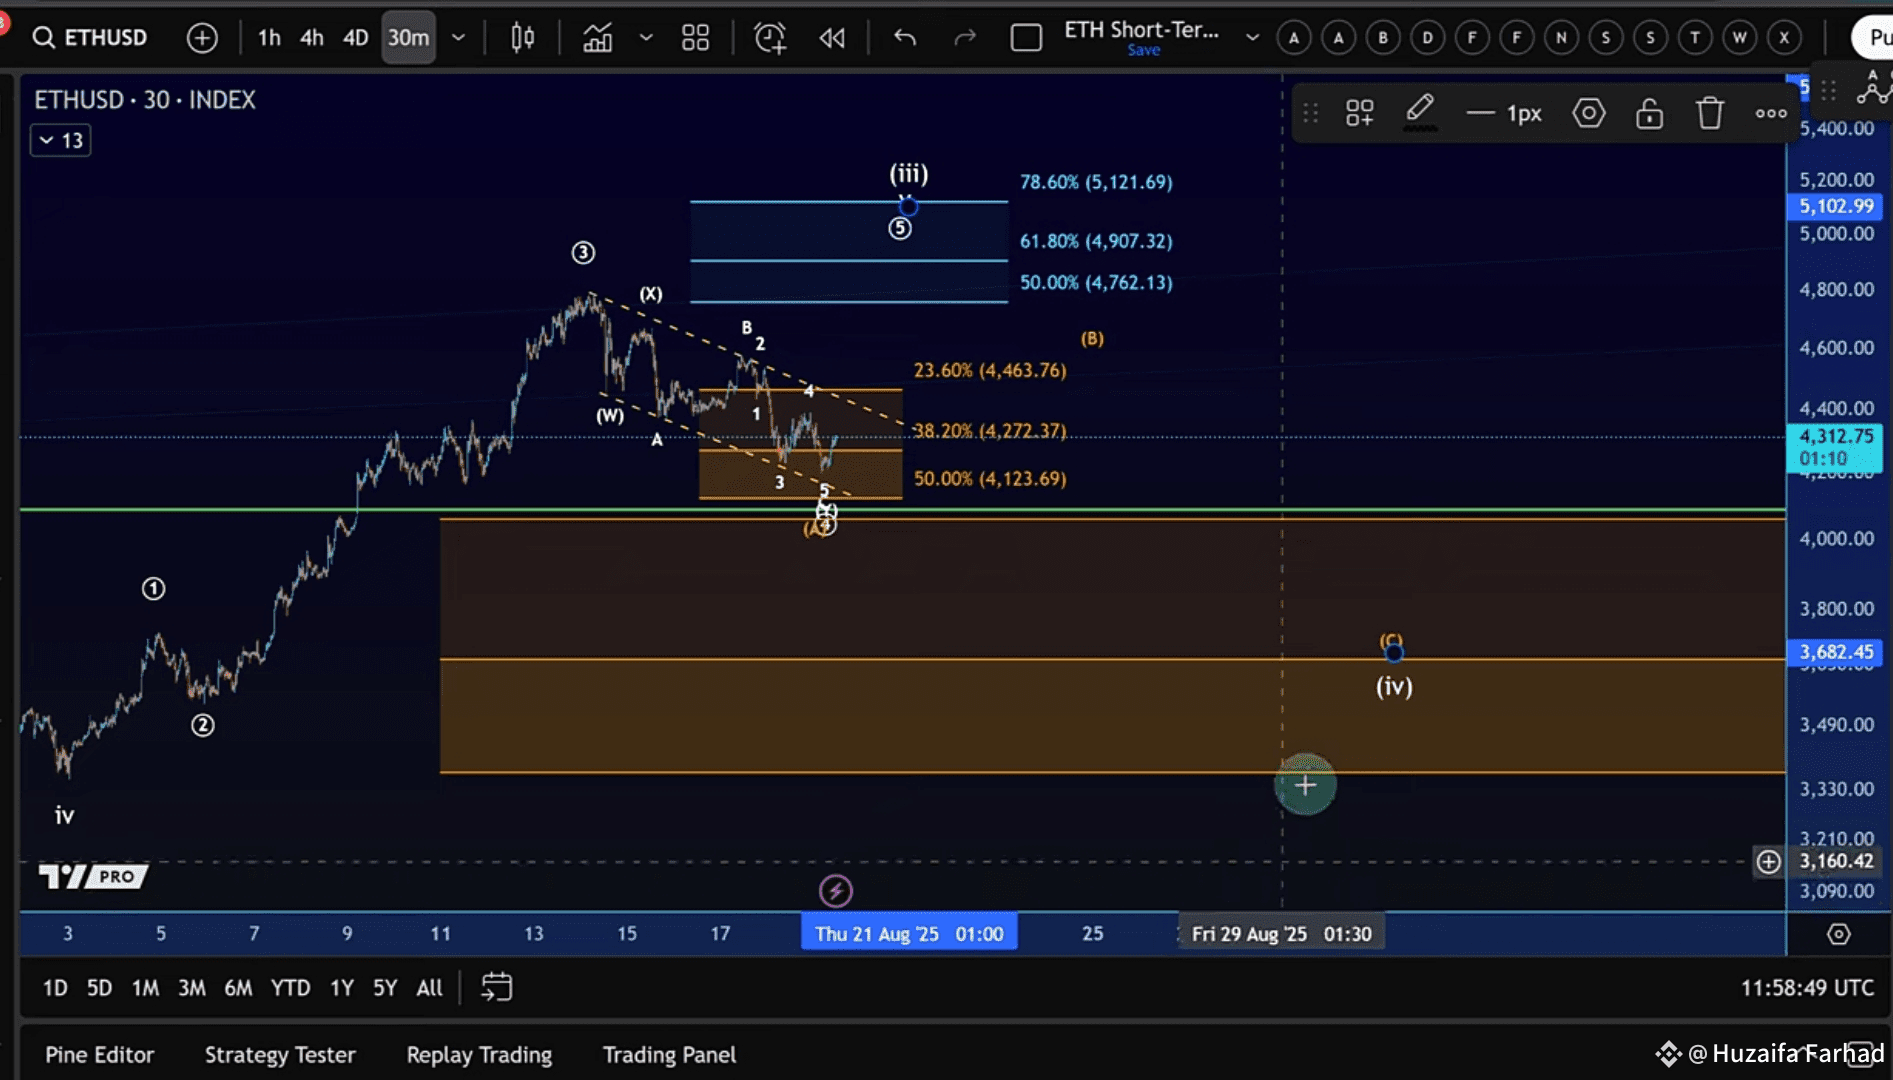
🔹 Key Support Levels
Ethereum is still holding above critical Fibonacci support zones:
$4,100 – $4,120 → Must hold to keep the immediate bullish scenario alive.
$3,370 → As long as this holds, Ethereum can remain in a larger bullish pattern.
A decisive break below $4,120 (not just a wick) would indicate a broader Wave 4 correction.
🔹 Upside Targets
If bulls defend $4,120 and break out:
First resistance: $4,760 (previous swing high).
Next target zone: $4,900 – $5,120.
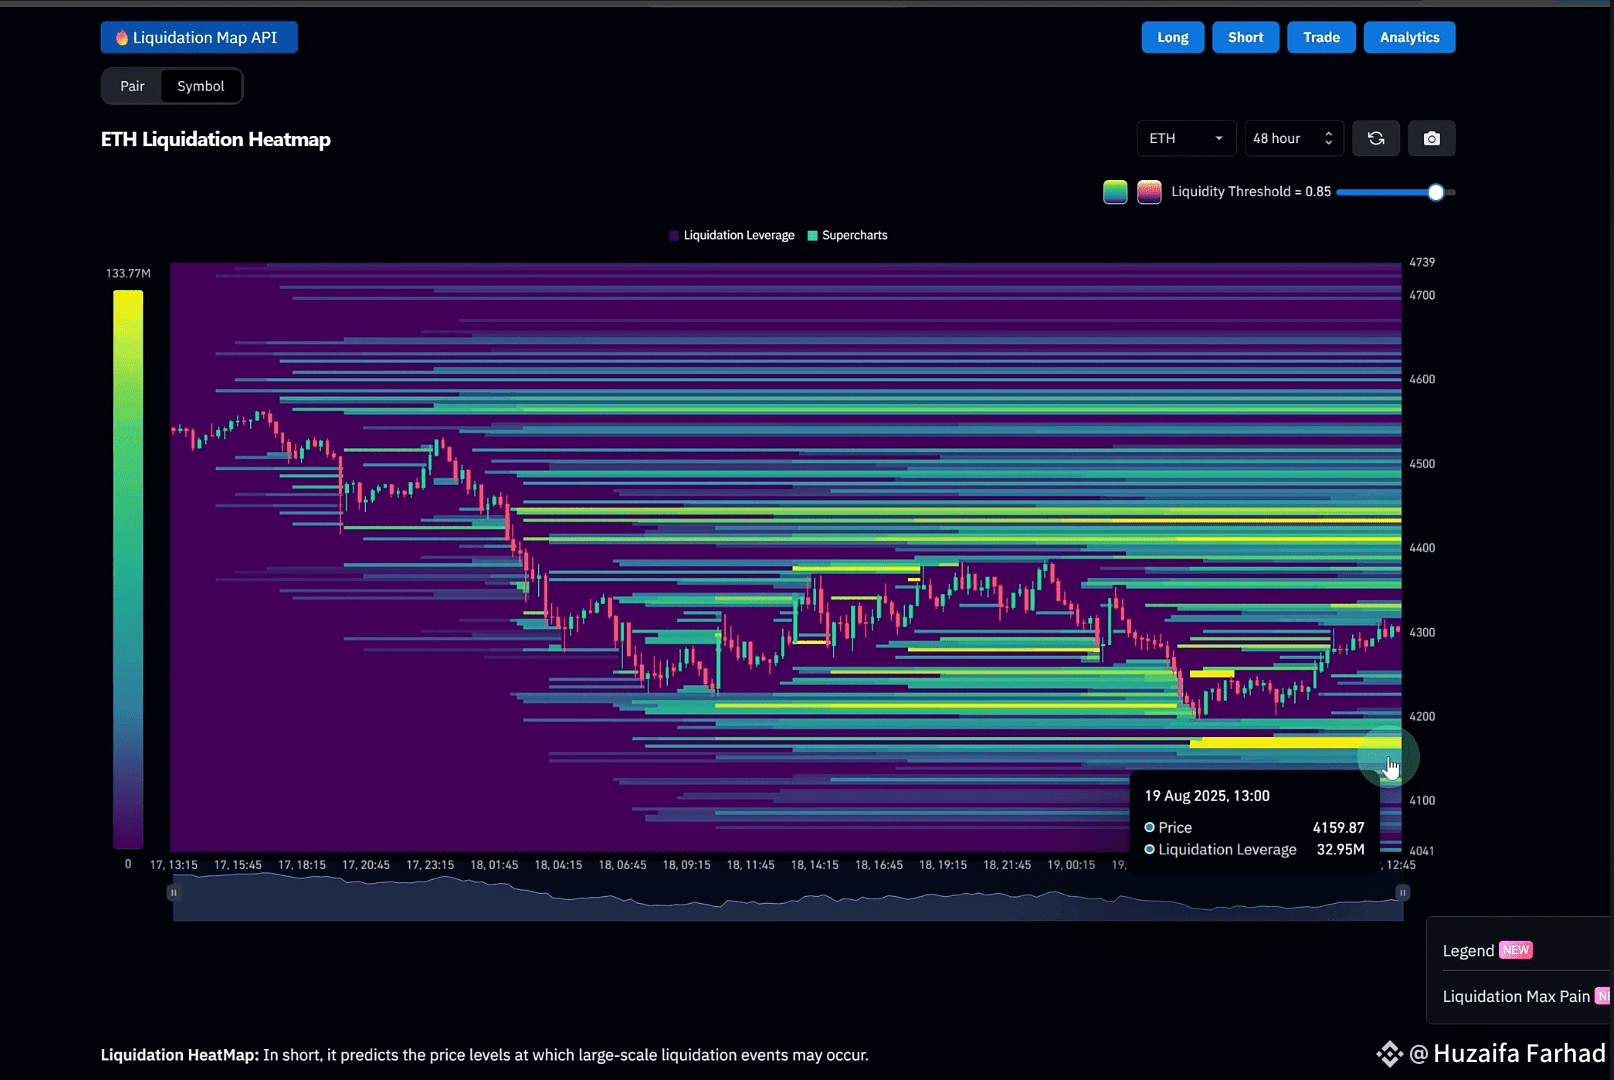
🔹 Heatmap Insights
Looking at the liquidation heatmap:
There’s a liquidity cluster near $4,130, aligning with the 78.6% retracement level.
To the upside, notable liquidity is sitting around $4,400 – $4,450.
This suggests the market could first grab liquidity around $4,130 before attempting a breakout.