Cardano (ADA) remains under selling pressure, extending its downward trend and currently fluctuating around the 0.91 USD mark on Tuesday morning, after losing nearly 4% in the previous trading session. On-chain data shows many investors accepting to cut losses, reflected in the negative NPL index – a sign that pessimism is dominating the market. From a technical perspective, ADA still faces the risk of falling deeper into the support zone of 0.84 USD before it can establish a foundation for a significant recovery.
Cardano's on-chain data signals increased selling pressure
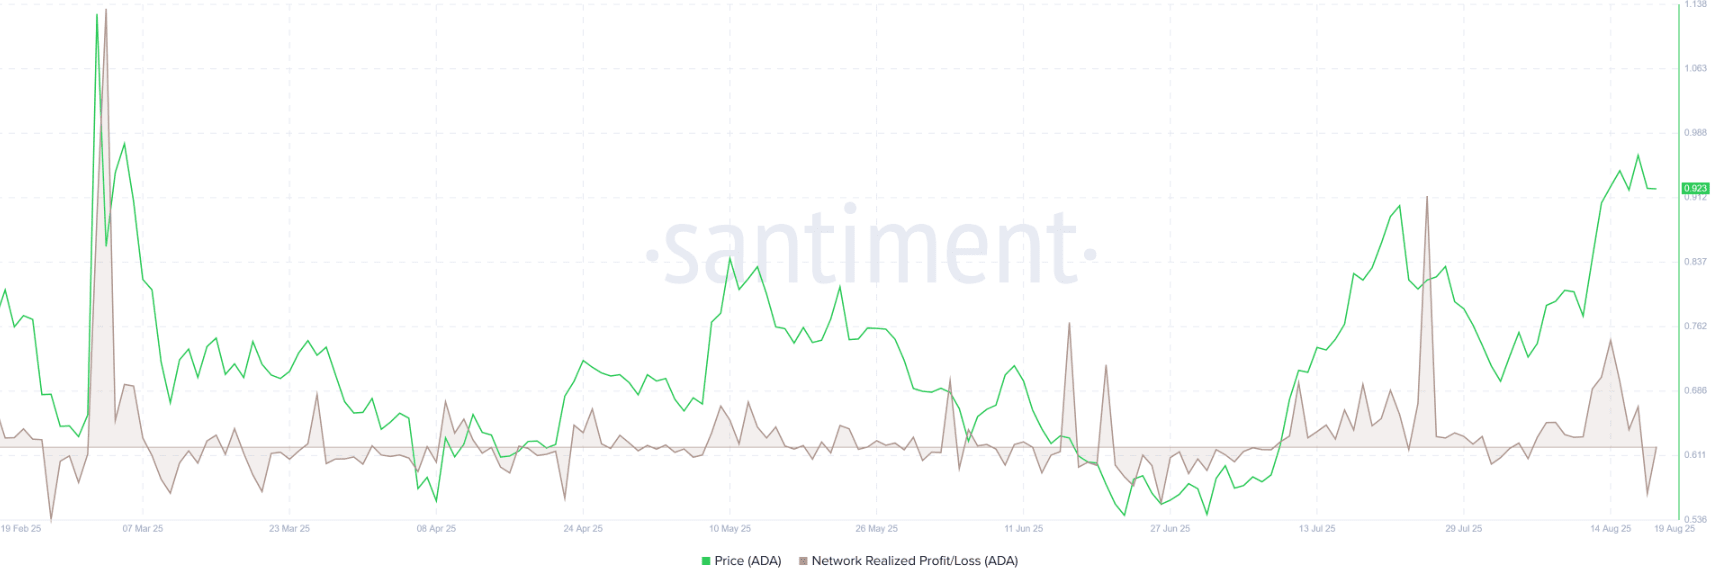
The Network Realized Profit/Loss (NPL) indicator from Santiment measures the daily return on investment (ROI) at the network level, based on the on-chain trading volume of each coin. When NPL soars, it reflects that investors are taking profits strongly. Conversely, a deep drop in NPL indicates that most investors are accepting to sell at a loss, often accompanied by panic sentiment and signs of 'capitulation' in the market.
For Cardano (ADA), the NPL indicator has recorded a significant drop: from +23.13 million last Sunday to -26.56 million on Monday. This negative figure indicates that investors are rushing to cut losses, thereby increasing selling pressure. Historical statistics show that such 'capitulation' moments often pave the way for a rebound phase for ADA after a sharp price correction.
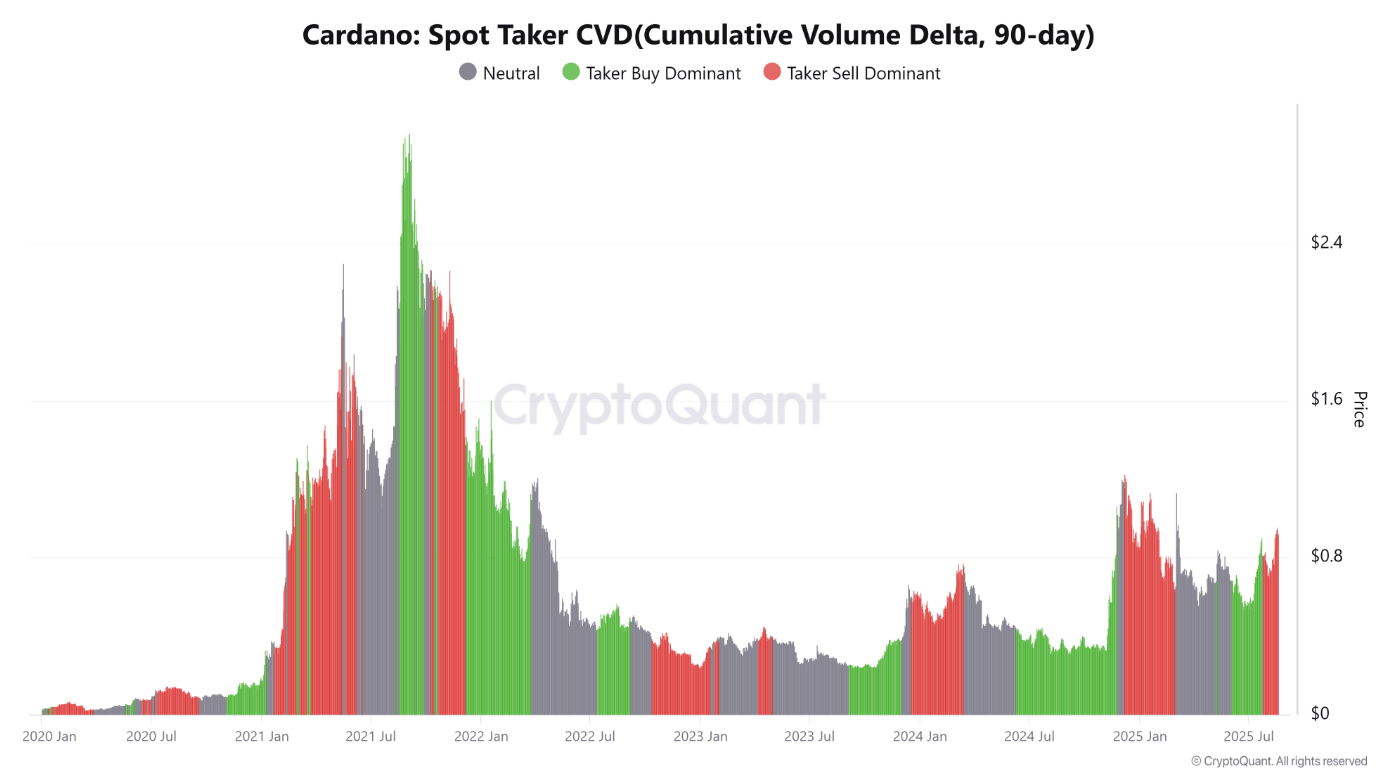
However, the short-term outlook still leans towards a downtrend. Data from CryptoQuant indicates that ADA's Taker CVD (Cumulative Volume Delta) indicator is currently maintaining a negative state and continues to expand, suggesting that the market is entering a Taker Sell Dominant phase – where selling pressure clearly outweighs.
Cardano price forecast: ADA may decrease before bouncing back
Cardano (ADA) made a breakthrough when it surpassed the psychological threshold of 1 USD on August 14, recording an increase of nearly 20% in just one week. However, the excitement quickly cooled down at the beginning of this week, with a decrease of 3.88% on Monday. As of the time of writing on Tuesday, ADA continues to fluctuate around the 0.91 USD mark.
Technical developments indicate that if the adjustment period continues, ADA risks falling deeper into the important support zone at 0.84 USD. The Relative Strength Index (RSI) on the daily frame is currently at 61, after bouncing back from the overbought area last Sunday, reflecting that bullish momentum is gradually weakening. At the same time, the MACD indicator records a contraction of the green histogram bars, further clarifying the retreat signal of buying power.
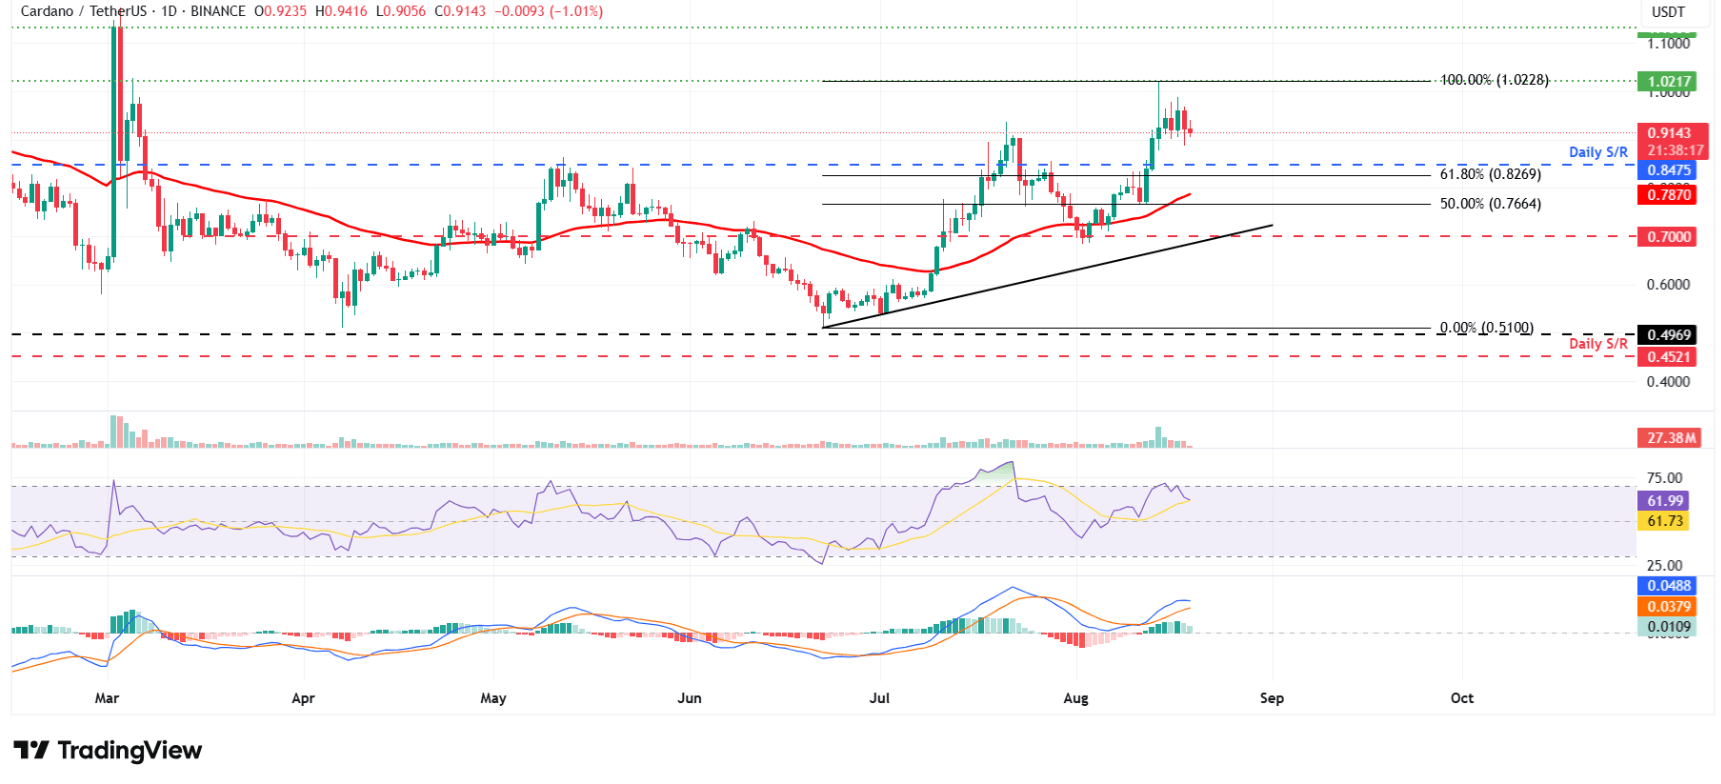
Nonetheless, the recovery scenario is still open: if demand returns, ADA can fully regain the psychological threshold of 1 USD, opening up opportunities for a new price surge.