
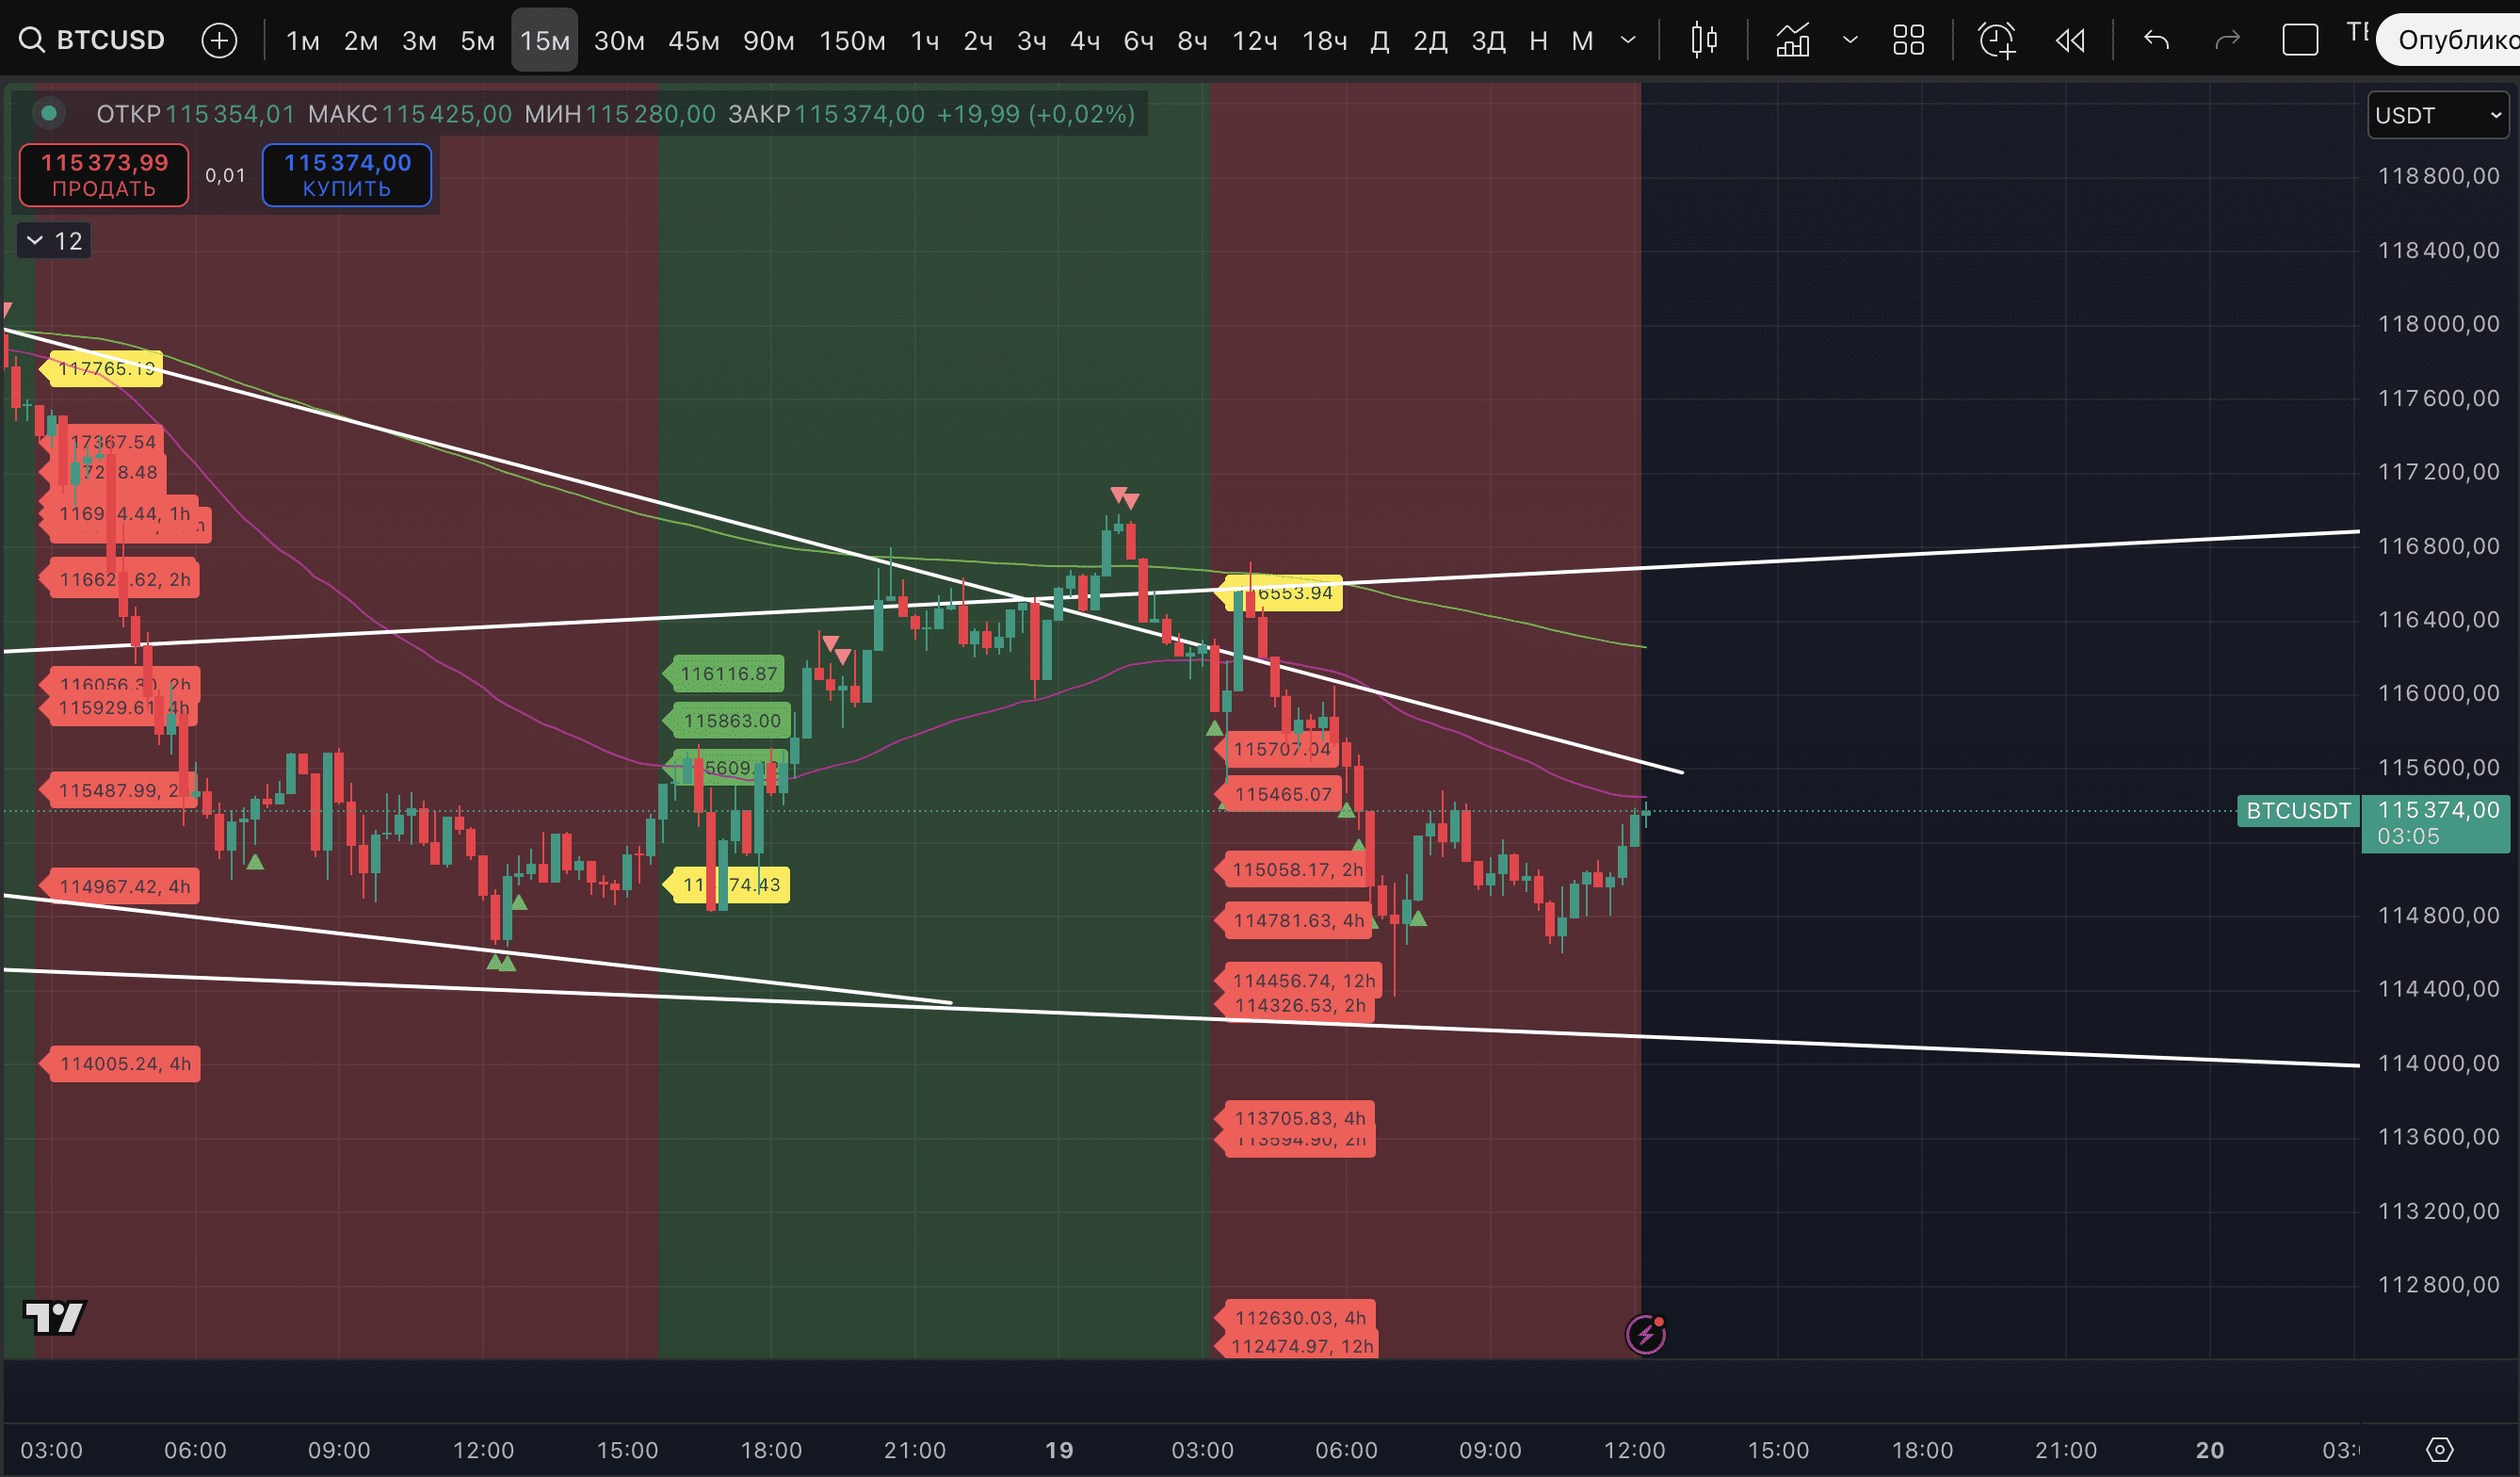
Overnight and in the morning, the BTC price showed a new impulse downward, with a new local low of $114,366. A pool of targets has been gathered in a downtrend on the 15-minute timeframe.
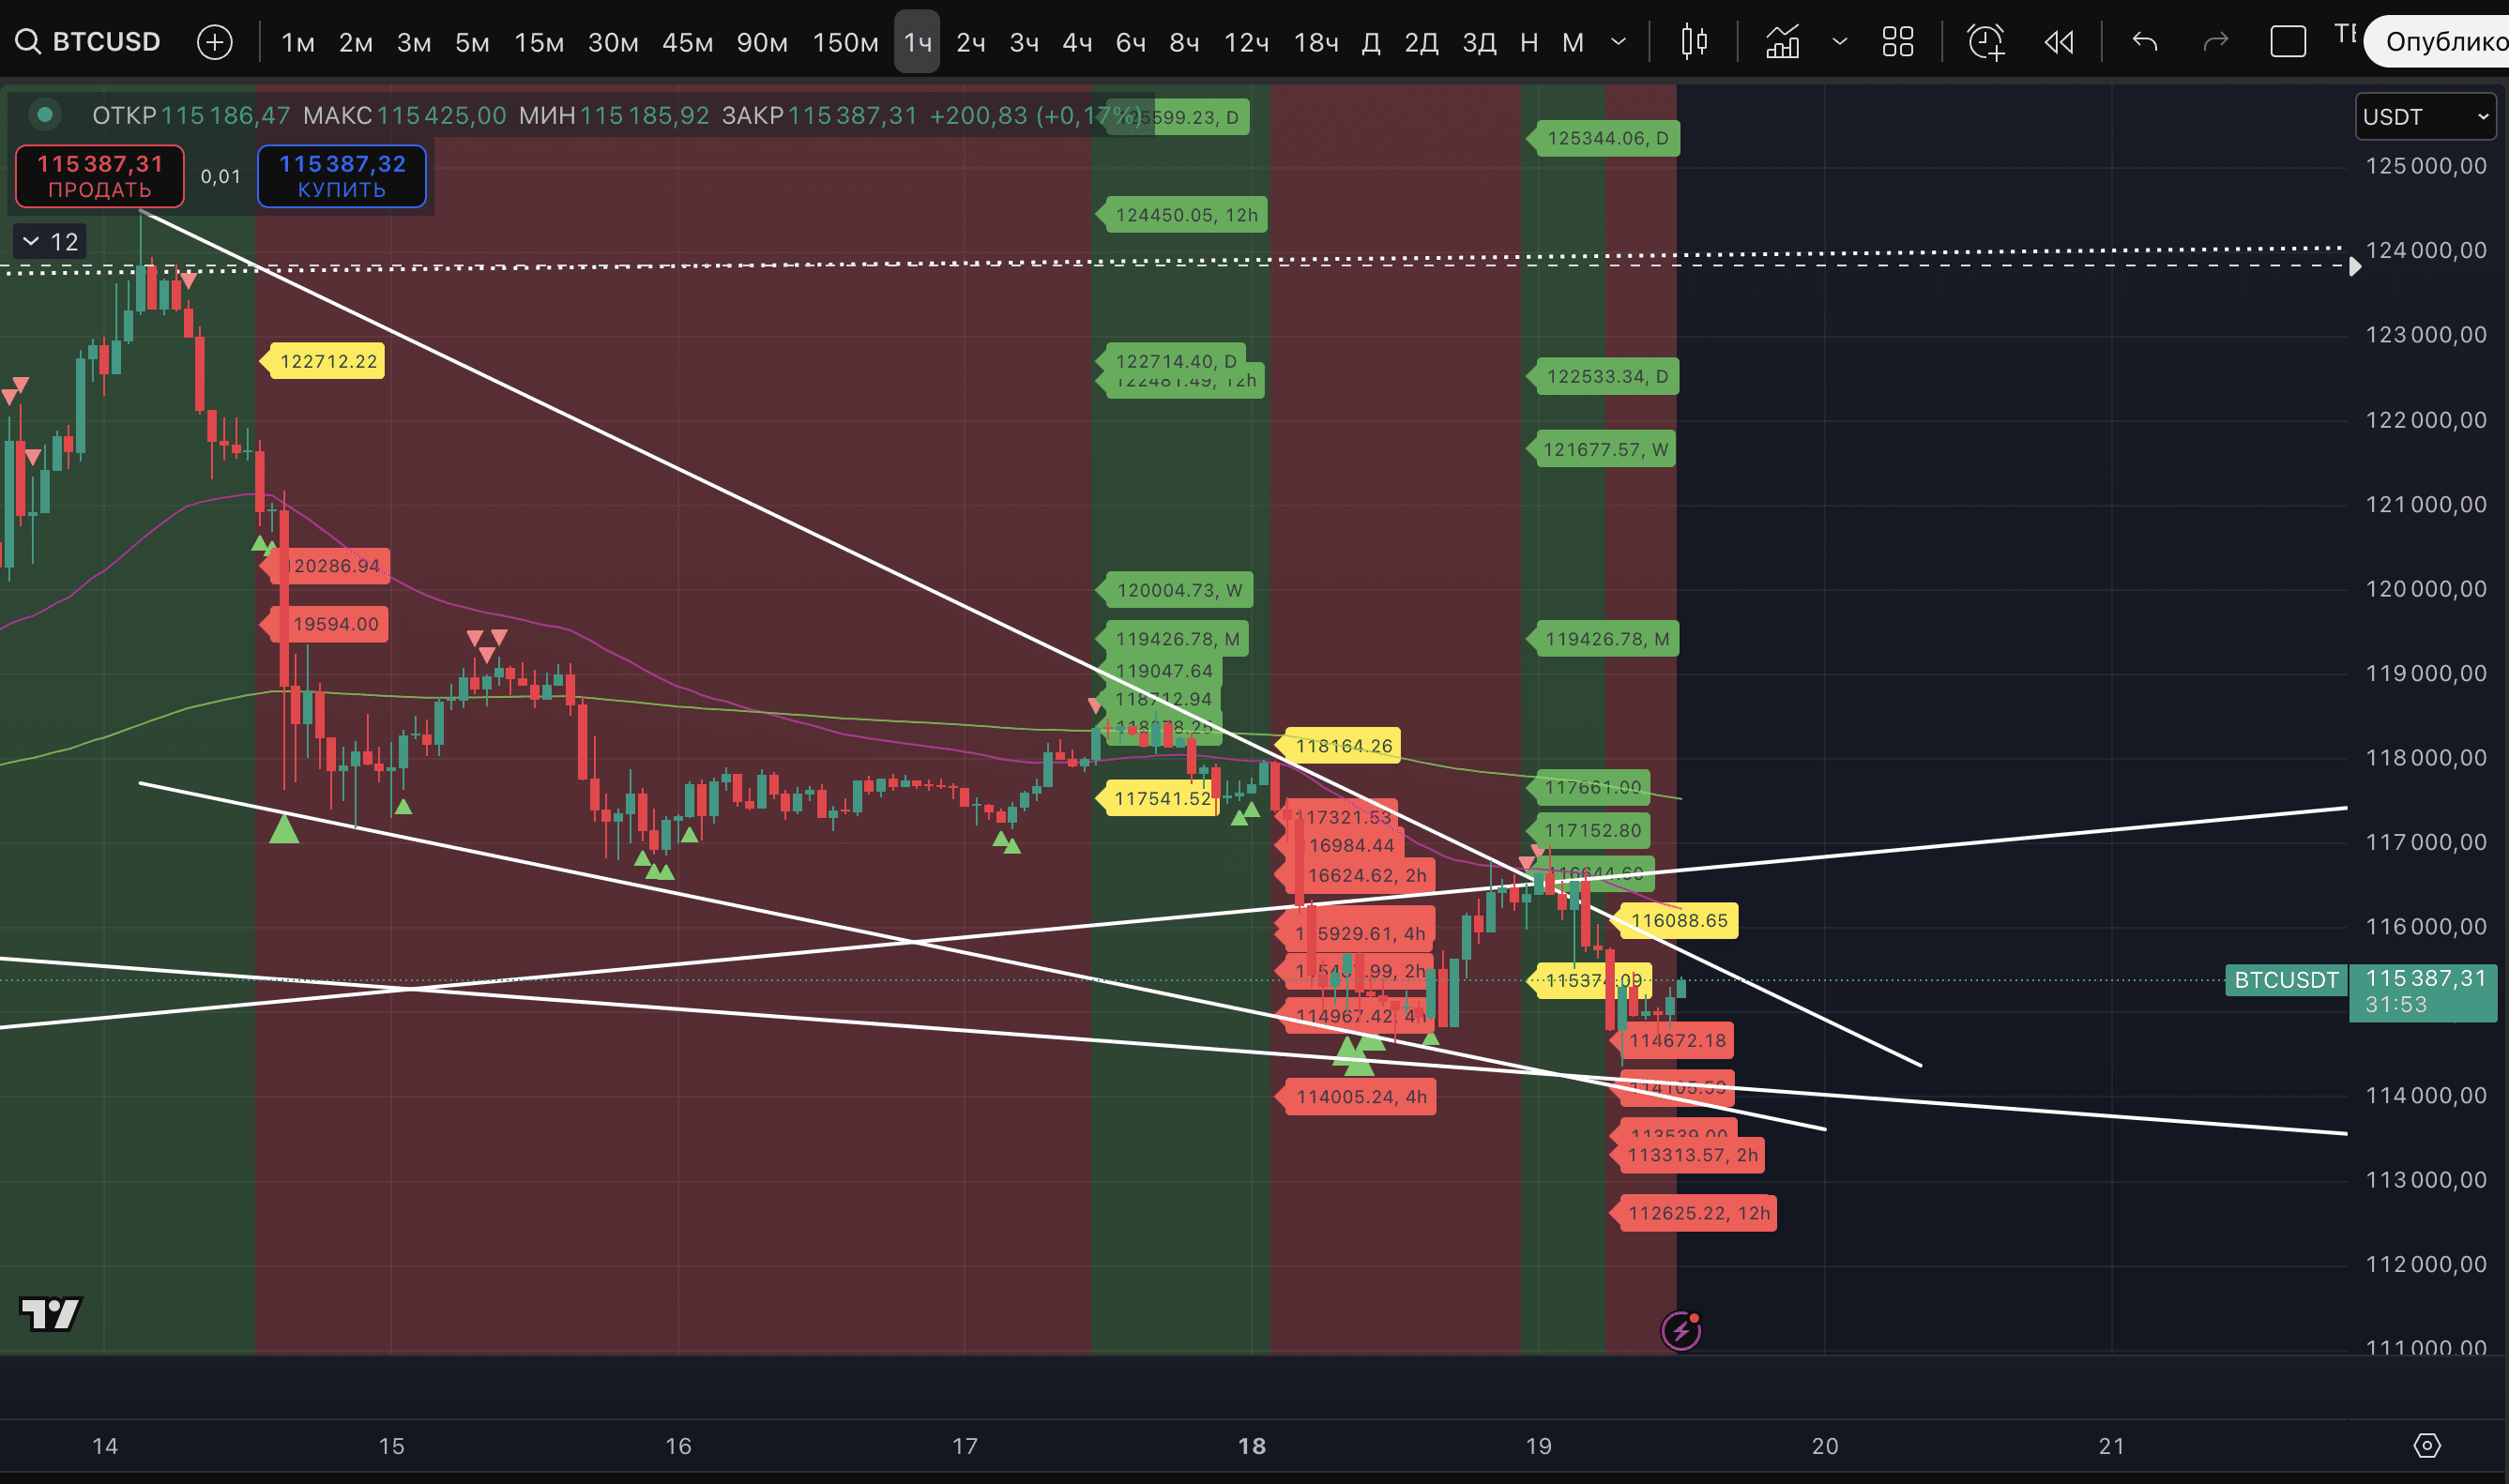
The uptrend on the hourly timeframe has reached the first basic target, fell slightly short of the second, and started to react to those potential high marks that caused concern. Plus, the EMA 50 on this timeframe acted as resistance. Ultimately, we have a reaction from two important trend resistances that were mentioned. There has been an additional liquidity accumulation for the bulls. As can be seen on the hourly timeframe, the price remains in a 'Bullish Wedge', showing a false attempt to break out of it overnight.
All long positions on #BTC during this decline have moved into positive breakeven, around +3%, enough to cover the transaction fees. For now, we are still 'on the fence'. Let's see how the situation unfolds throughout the day.
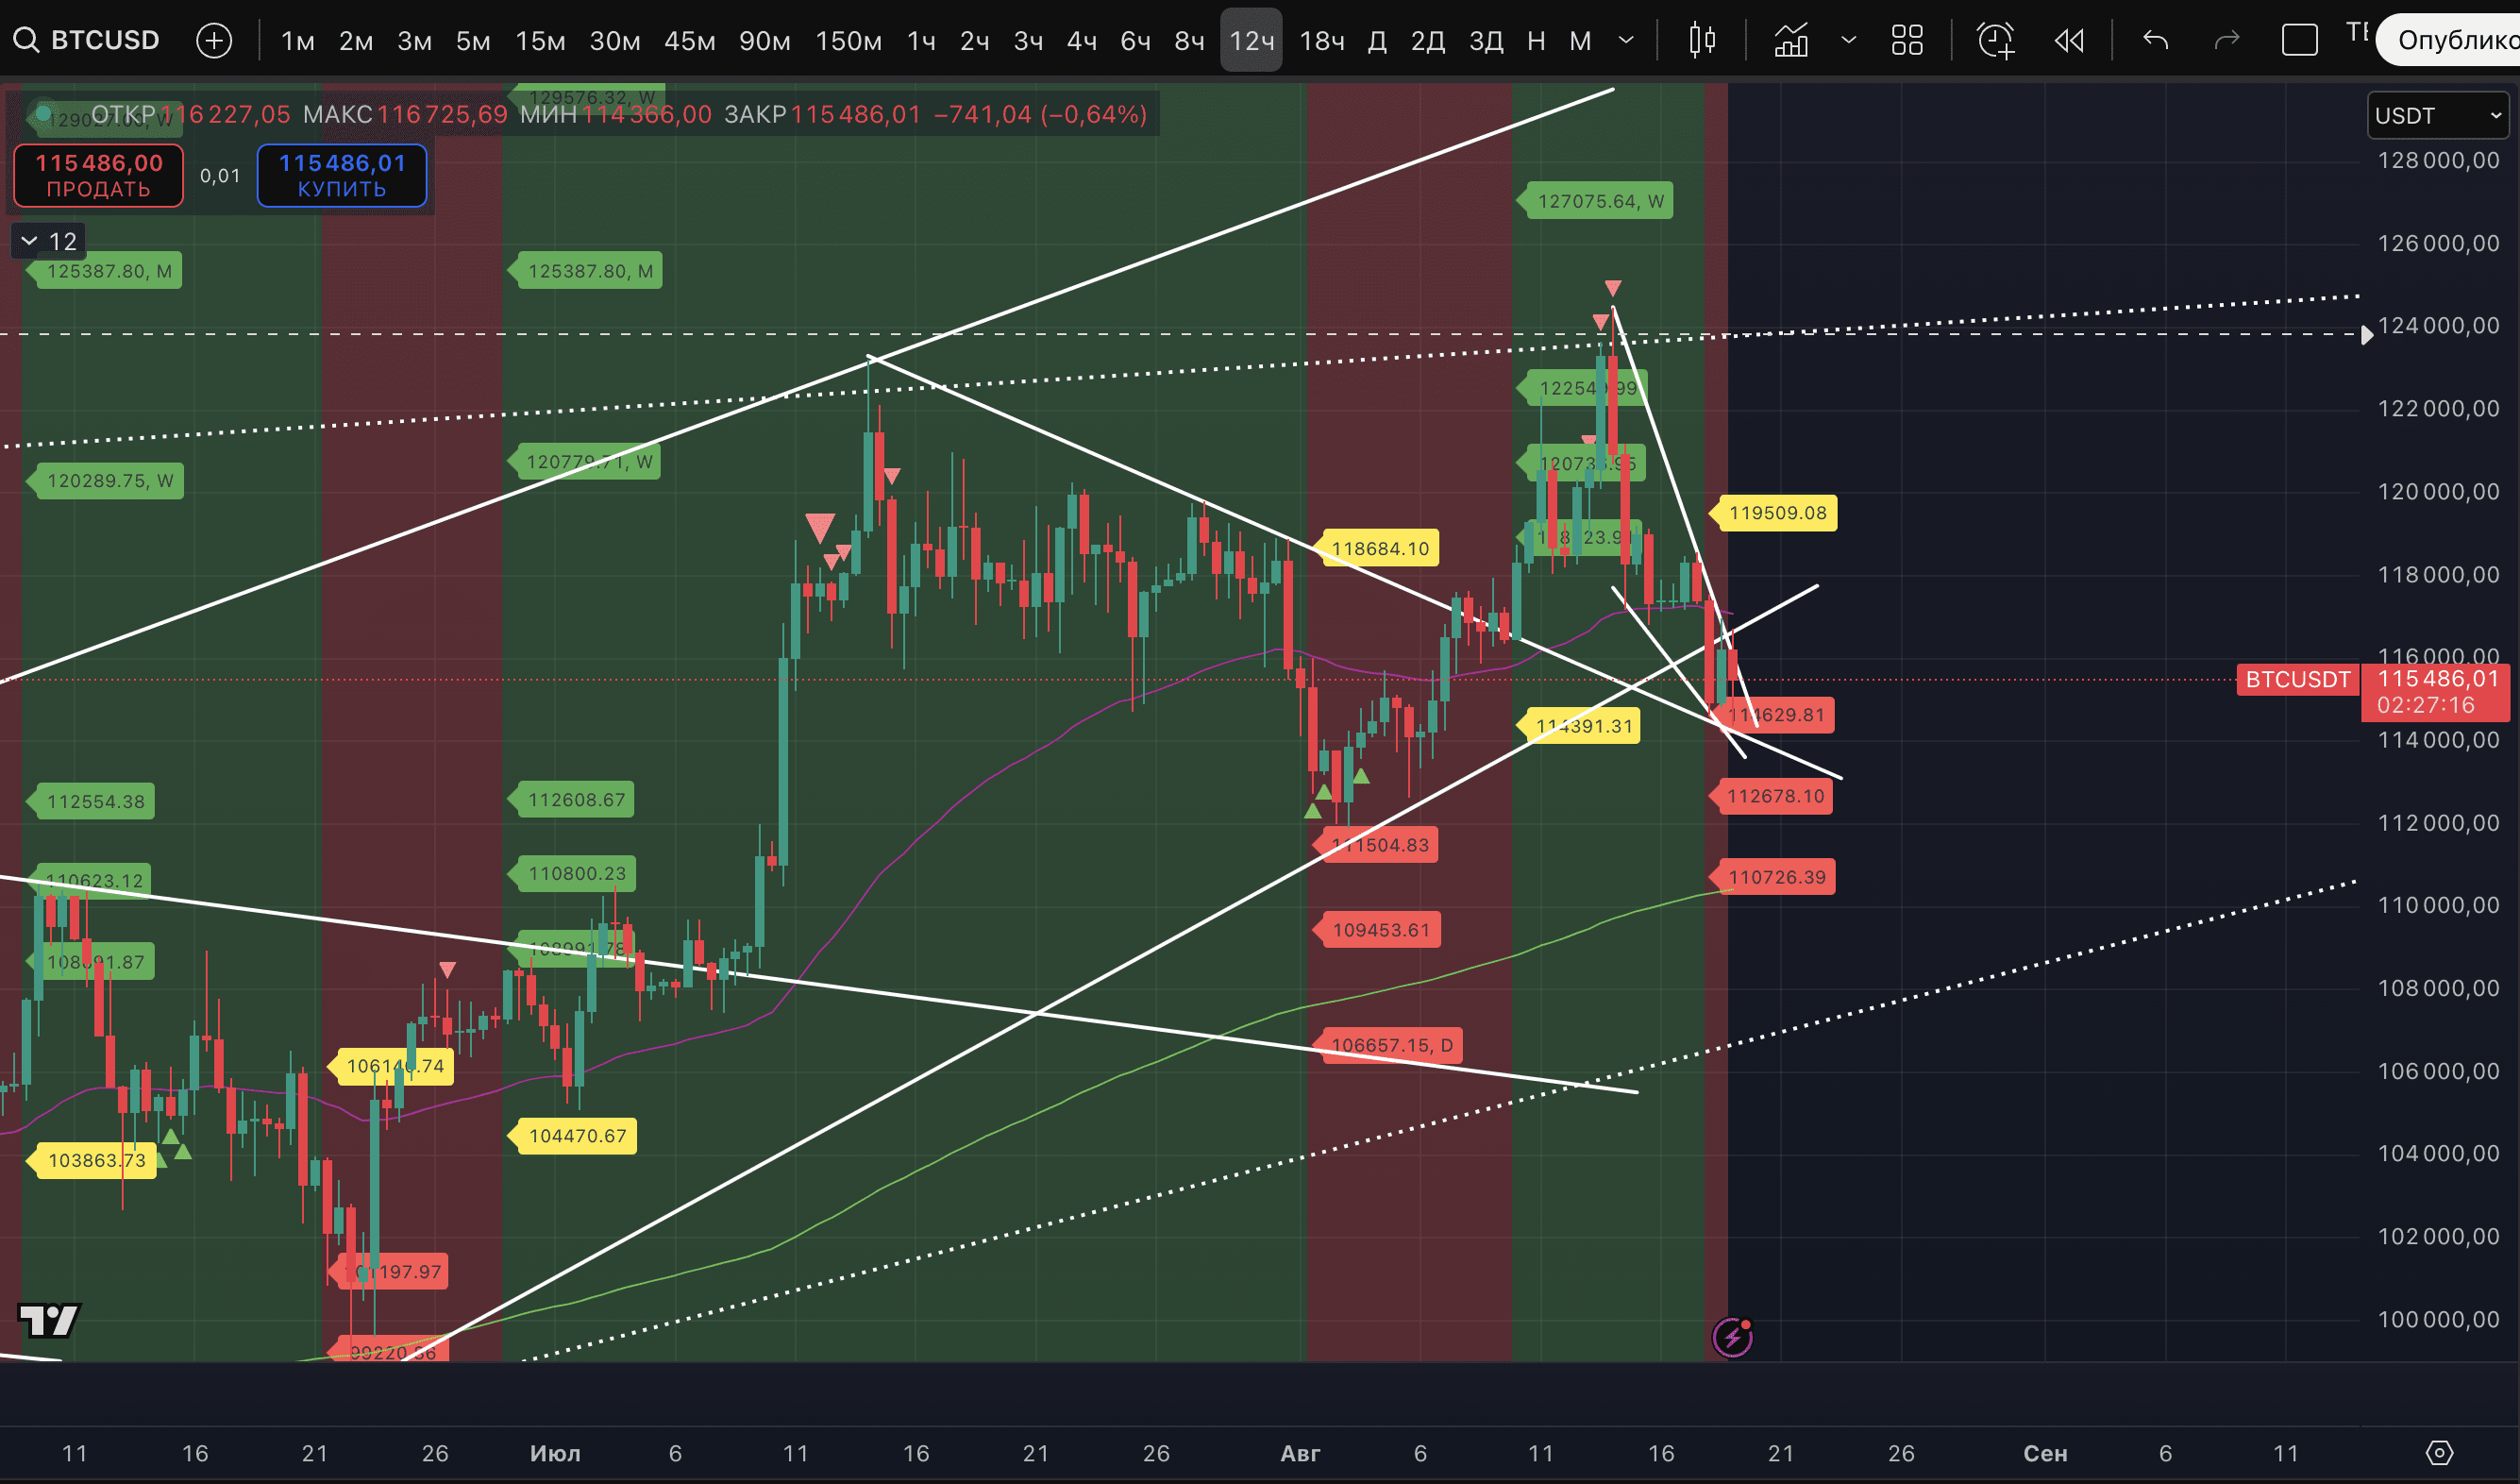
As already mentioned - we don't want to short the current situation. Even with a downtrend on the 12-hour timeframe. If there is a downtrend on the daily timeframe - then we will see. For now, it is not present.
If a daily downtrend appears - we will be ready for a new short on the rebound. Until then, there still seems to be potential for a reversal and growth above $120,000. But we are not ready to put money on this until new reversal signals appear. Ideally - from the extreme level marks.
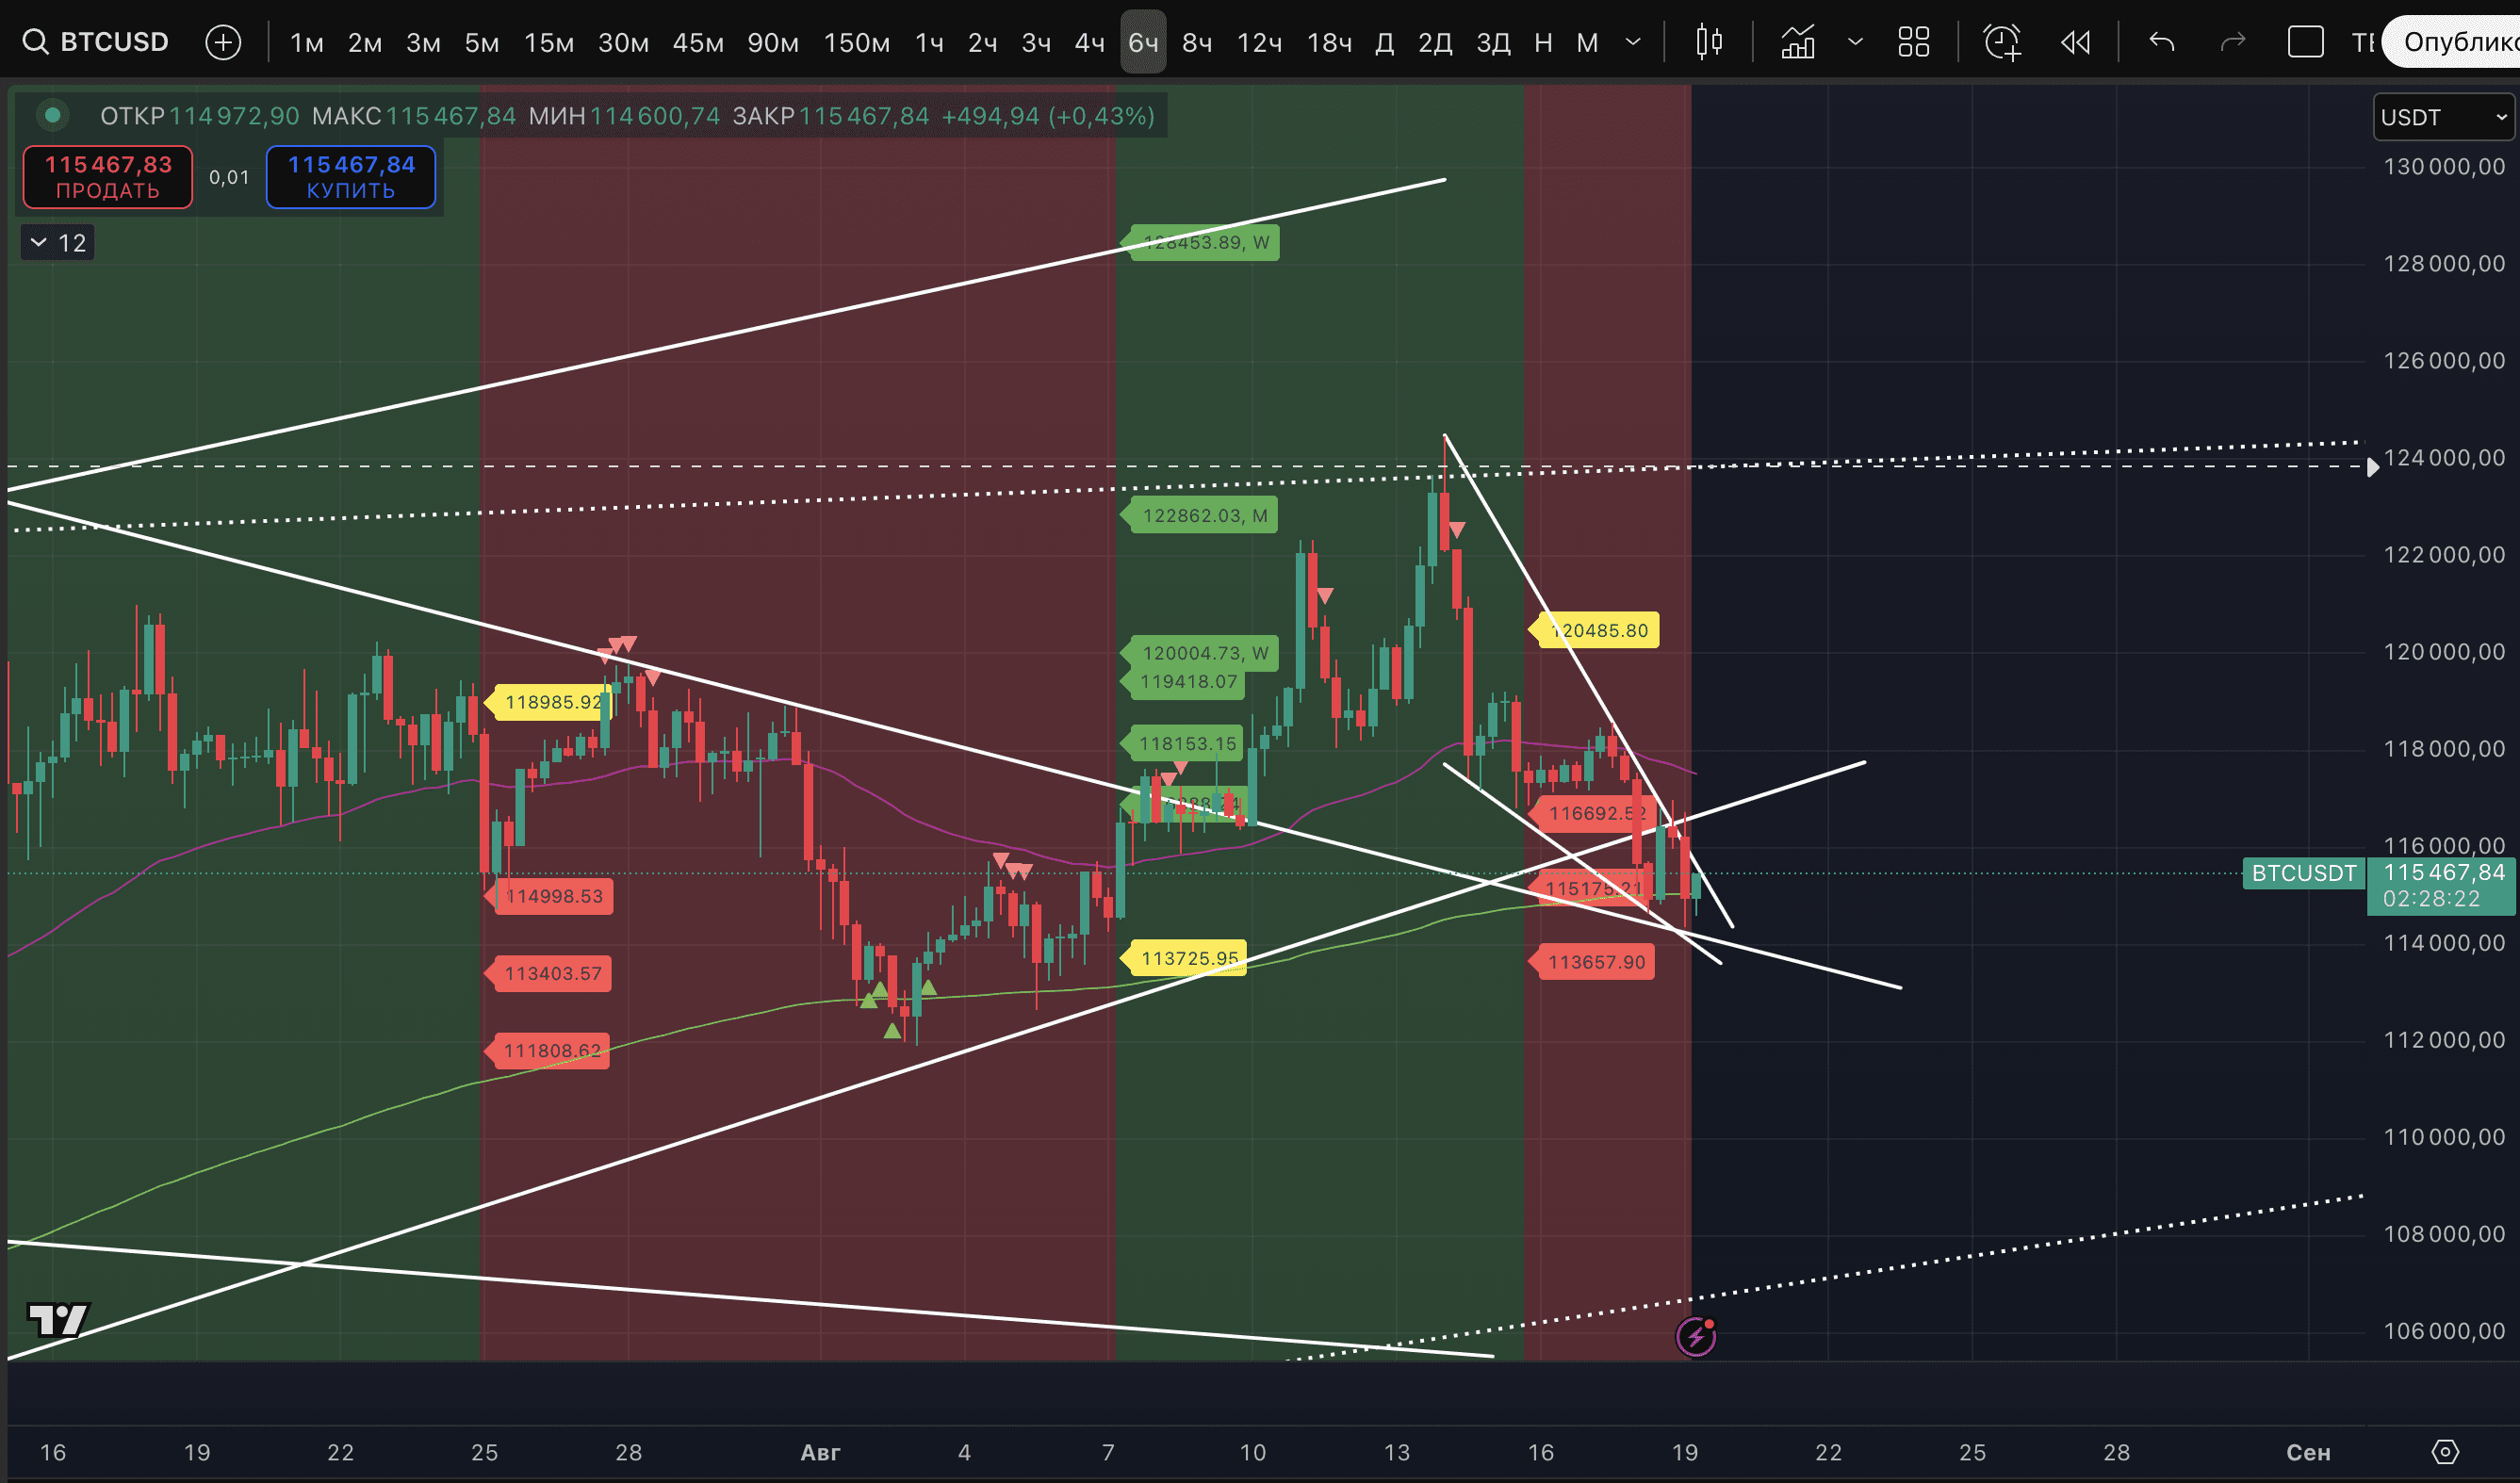
So far, with the start of a new downward impulse last night, the price seems to be forming something like a 'Bearish Pennant', with targets around $113,500 and $112,370. This should be taken into account. But let us reiterate - in our view, shorts from the current prices on #BTC may be a more dangerous endeavor right now. Precisely because the price is in an uptrend on the daily timeframe, and the level of potential breakdown is being maintained by the buyers.

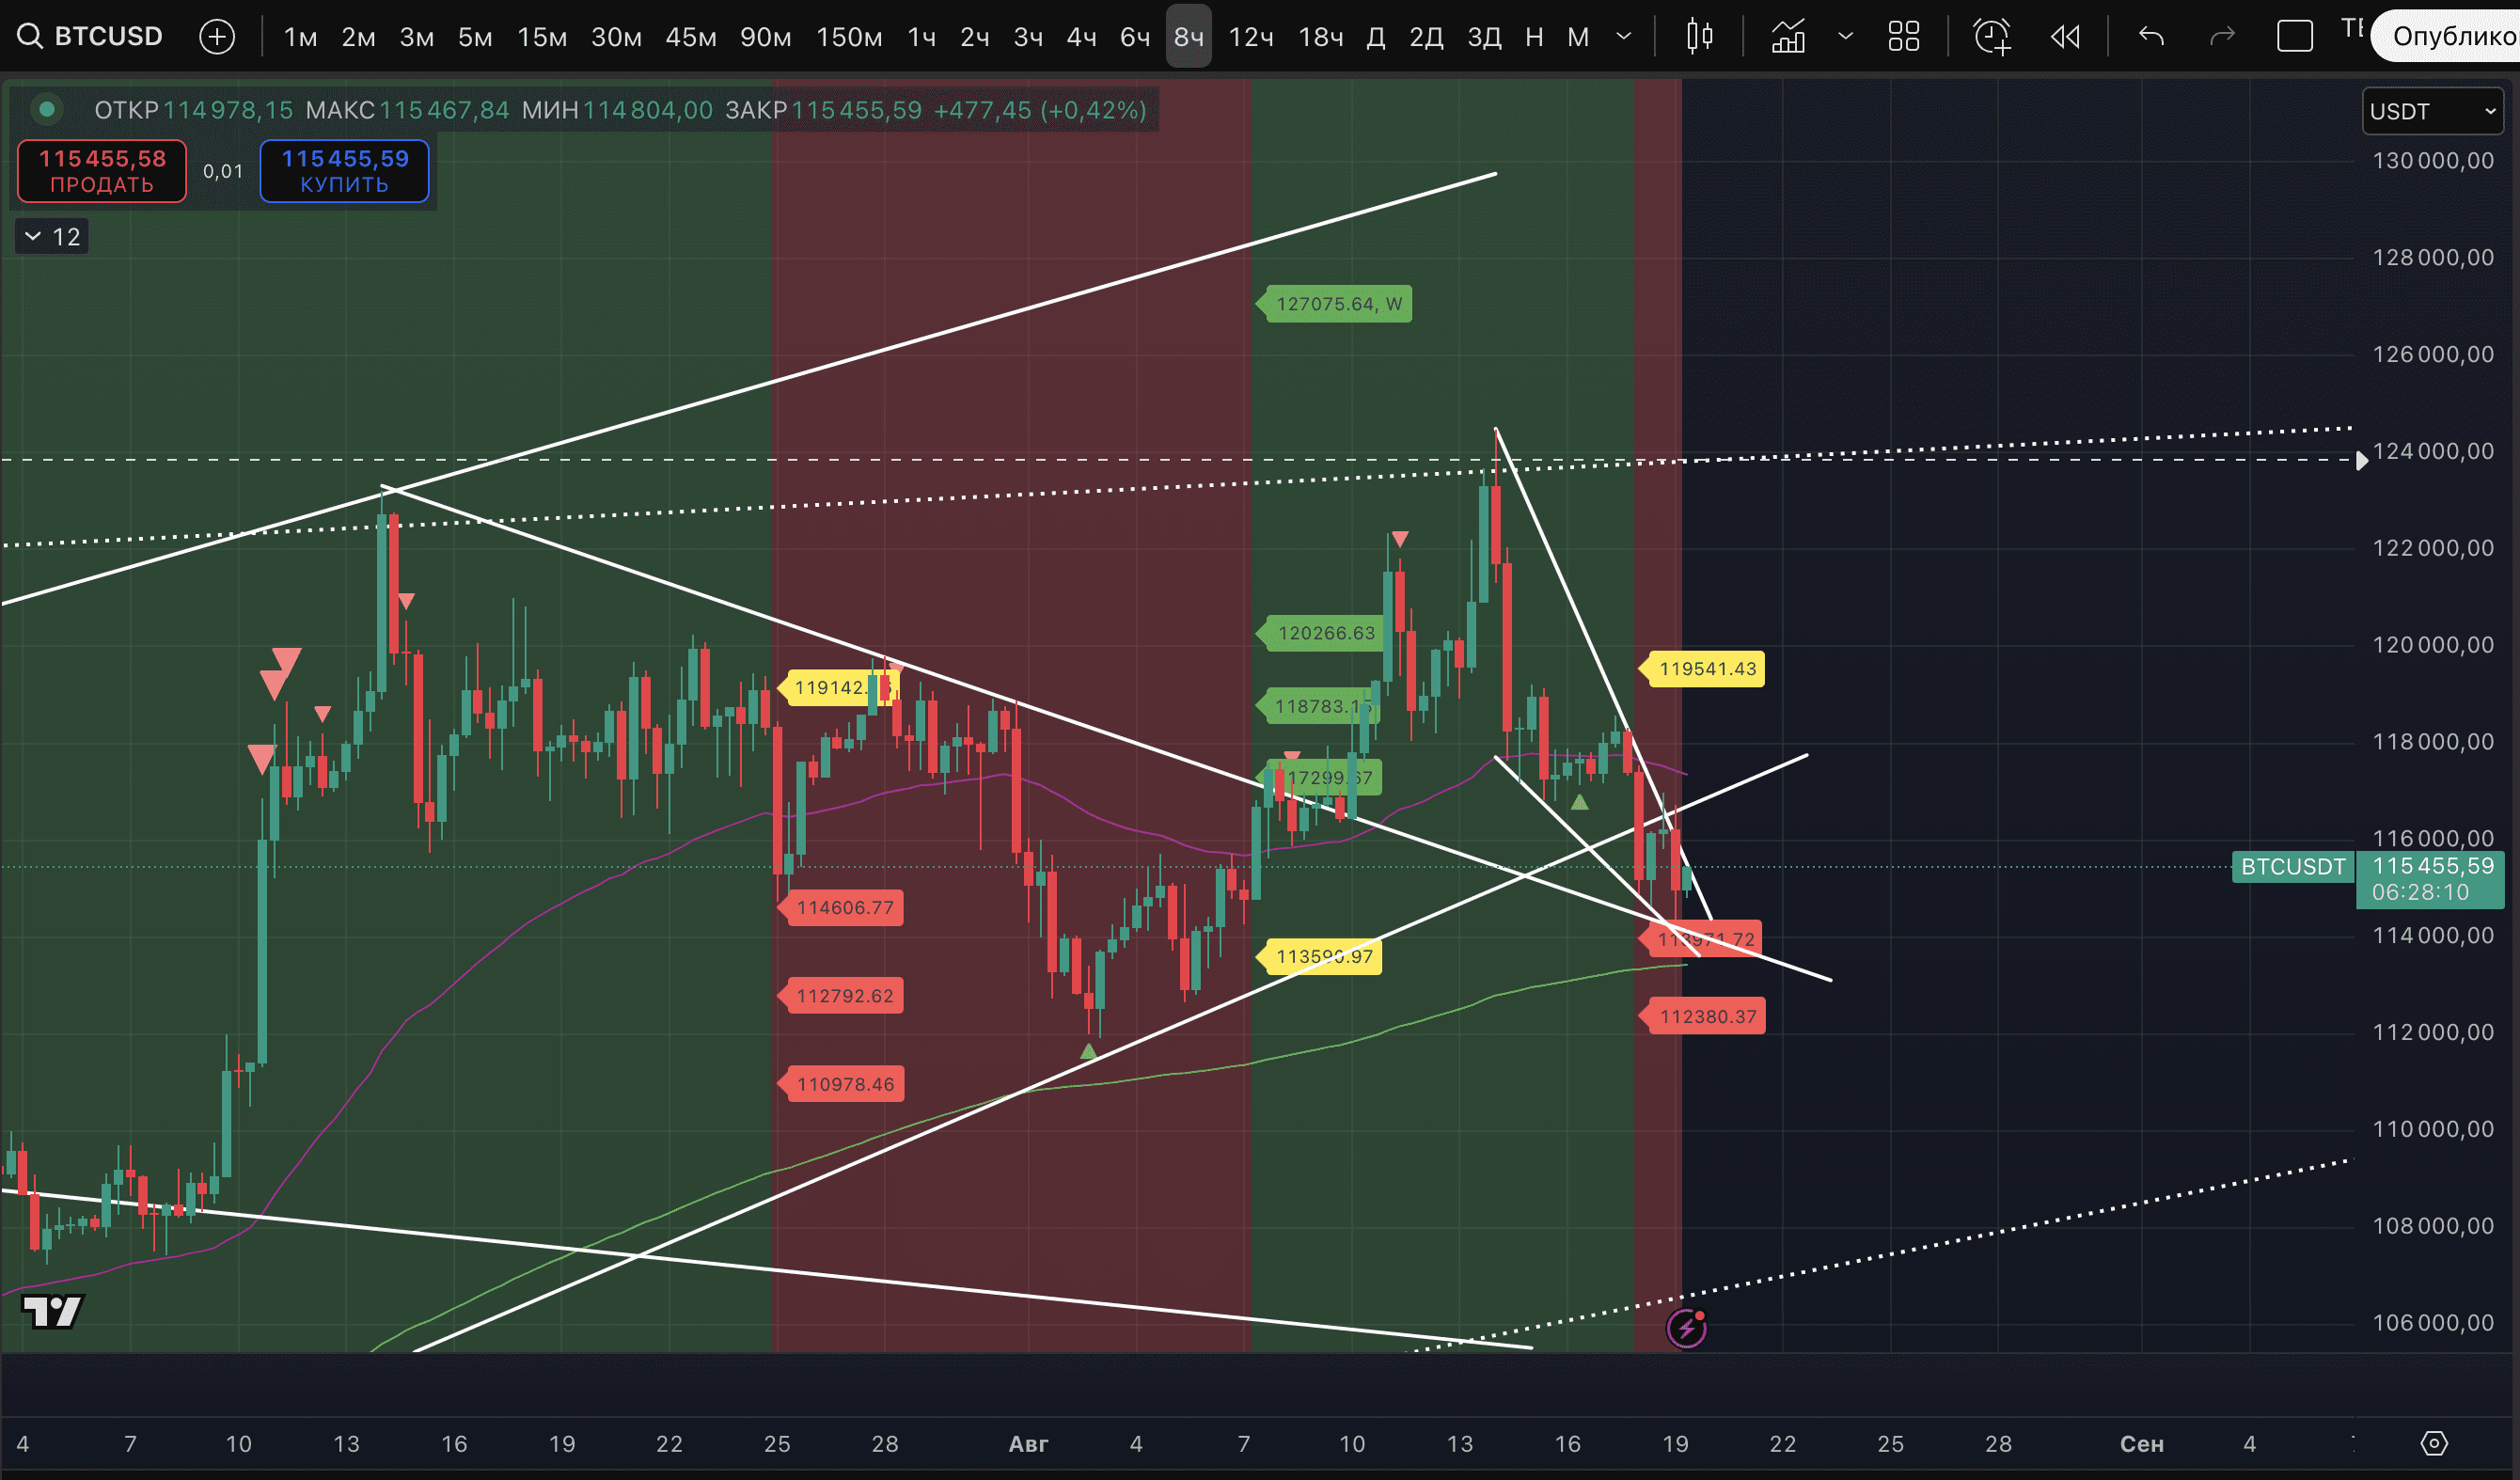
Regarding the EMA. On the daily timeframe, there is an attempt by sellers to pull the price below the EMA 50 of the daily timeframe, which is a concerning signal for the prospects of a reversal and growth. However, for the second day, the price is still being held above, although increasingly making deeper squeezes. For now, the buying pressure is holding above, including the EMA 200 of the 6-hour timeframe. However, on the 12-hour timeframe, we observe a consolidation below the EMA 50.
According to horizontal levels, as can be seen, we are in the density zone. Resistance above: $115,958, $116,459. Support below: $114,956, $114,330, $113,579, $112,827.
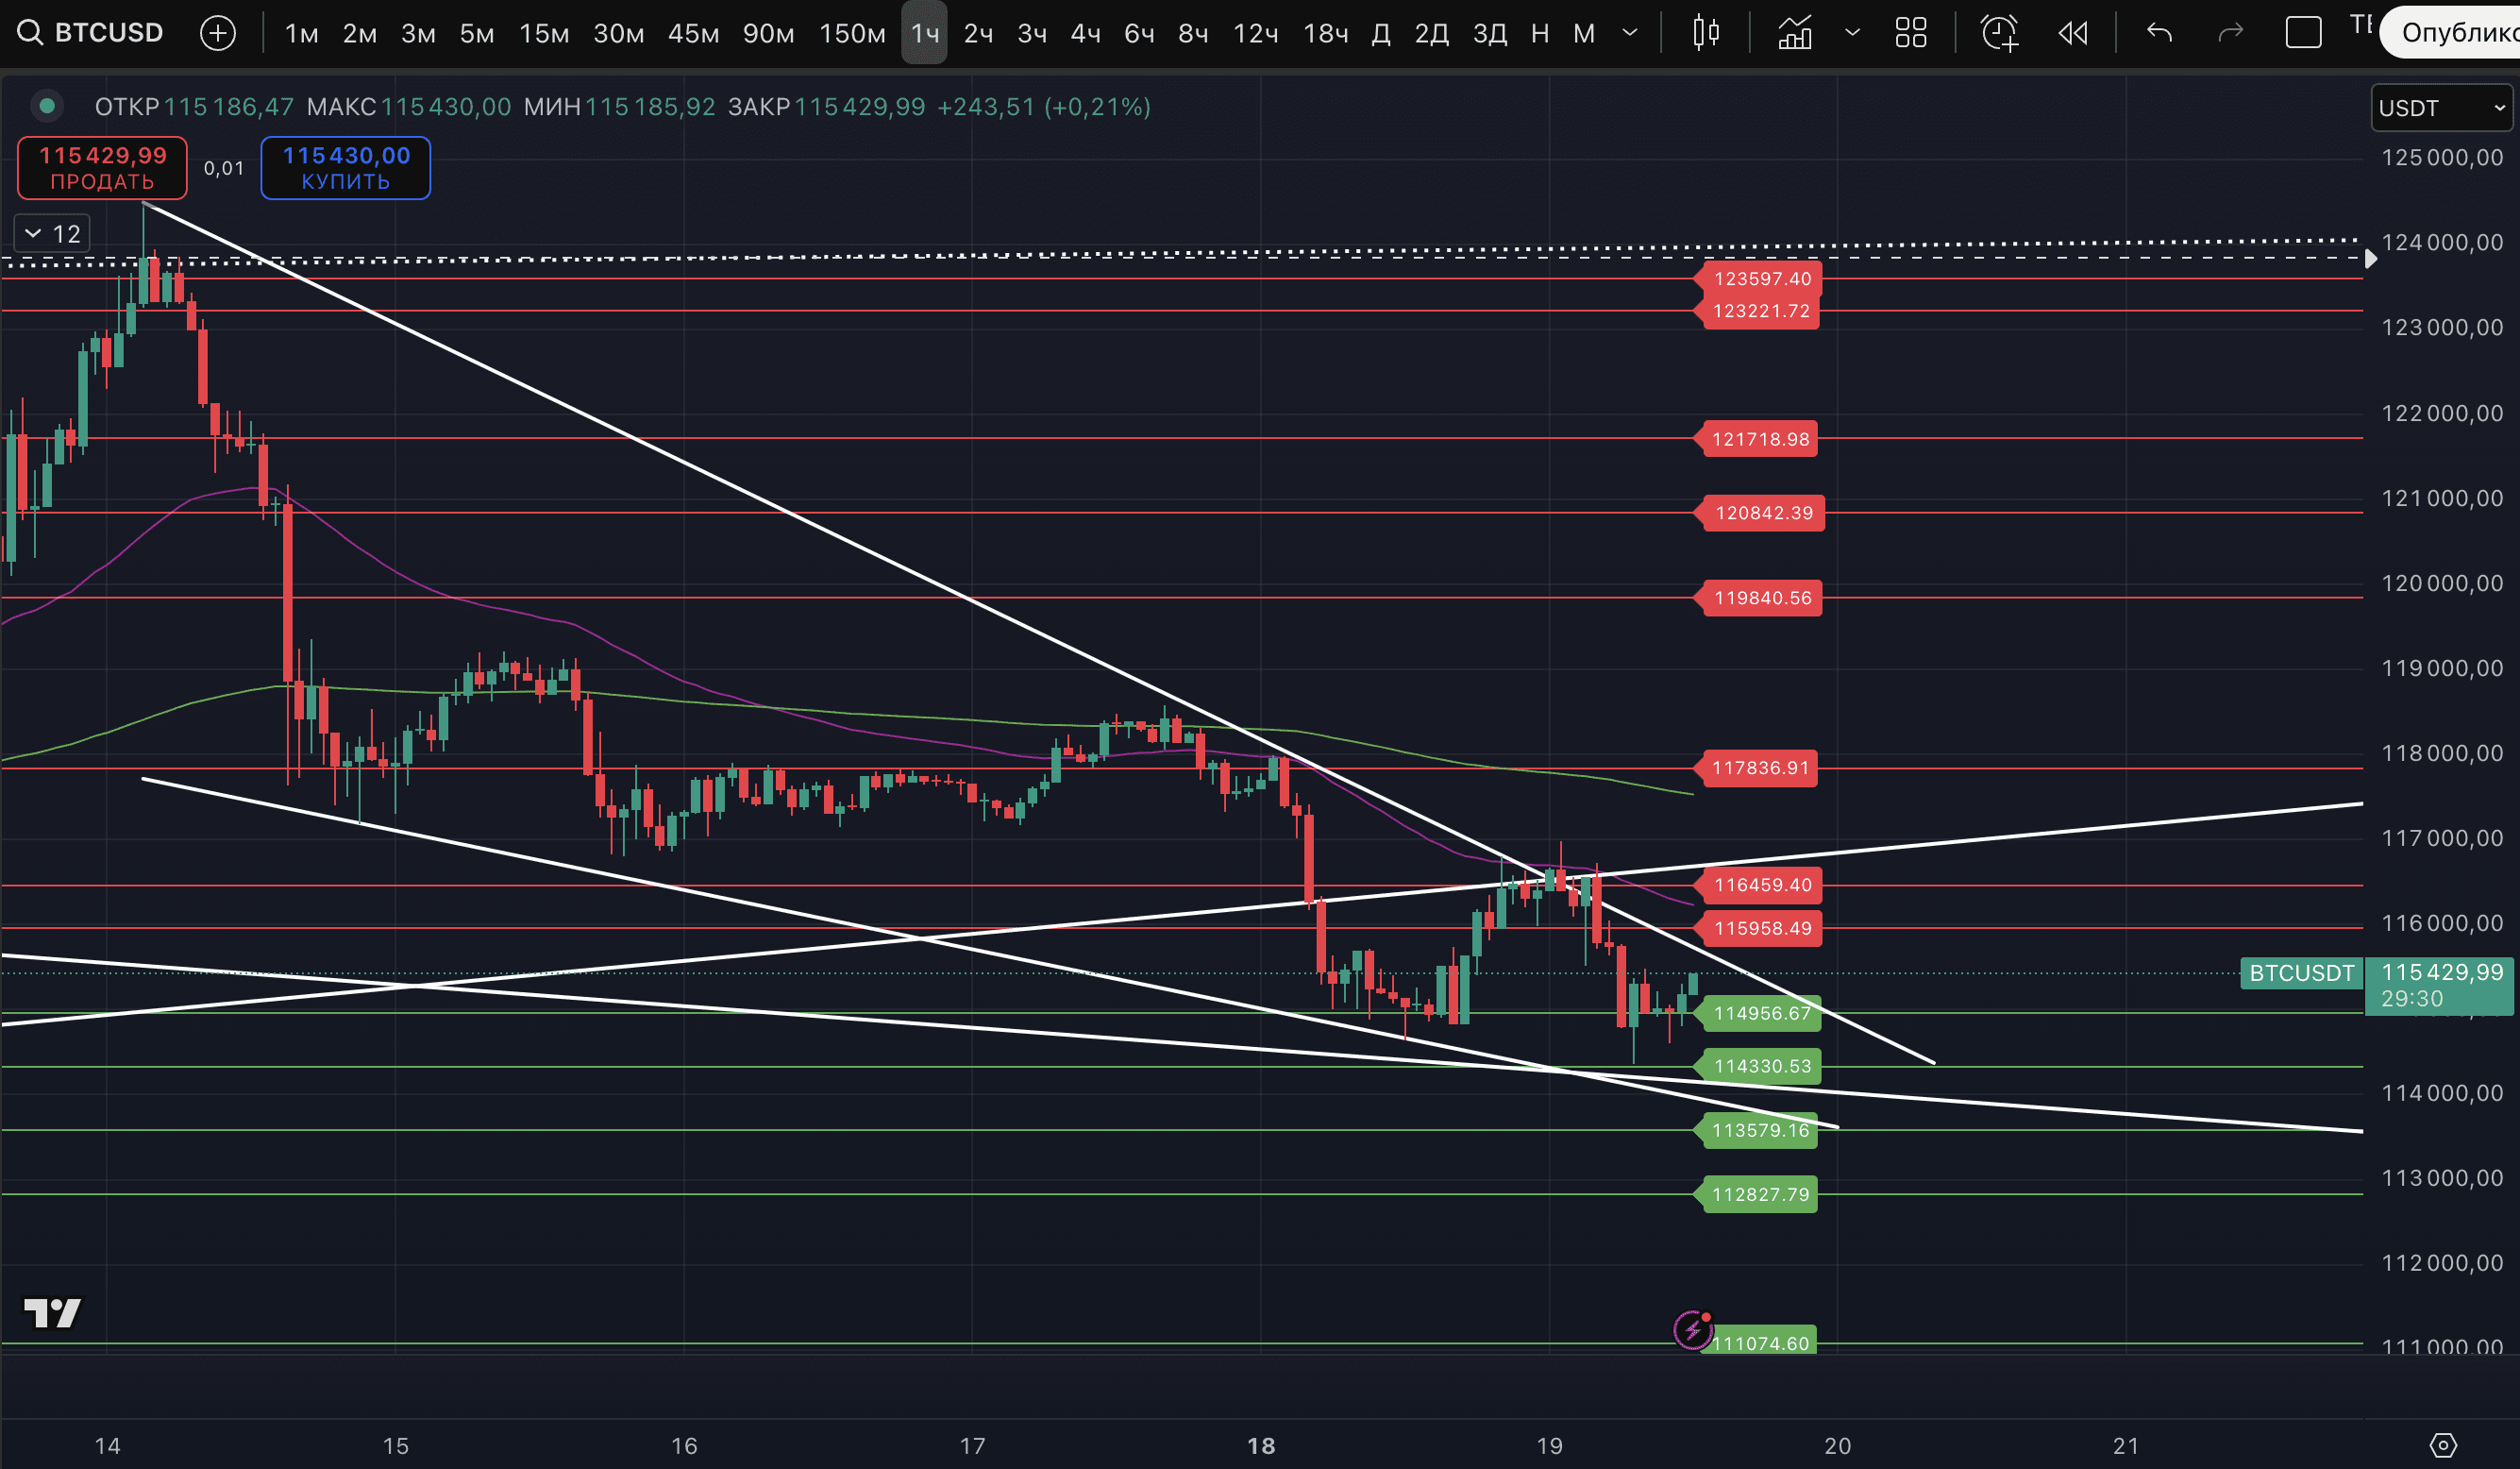
Only a break of support at $112,827 can show an impulsive move toward $111,074. For a chance to return to growth, we need to secure above at least $116,459. Ideally - $117,836.

