The difference lies in your margin + difference, which involves the difference in strong closing price *!
Coin circle contract + correct way to open:
In March 2024, in just over a month, I used a principal of 4940u to earn nearly 20,000U, a full 4 times!
My way of trading contracts is simple and applicable, suitable for everyone!
A trading system is not a jigsaw puzzle, but more like a military strategic deployment. You can't just buy a gun (opening signal) and think you can win a battle. You also need shields, defenses, retreat plans, and supply lines.
In my opinion, a qualified closed-loop trading system must include the following seven modules:
1. Risk Control:
Risk control is the system's "firewall."
You are not avoiding losses, but avoiding "fatal losses."
For example: If you have a sharp knife but no sheath, you will eventually hurt yourself. Risk control is the sheath for that knife.
2. Position Management:
Controlling positions is controlling fate.
Market fluctuations are like ocean waves, and position size is the weight of the hull.
If the position is too heavy, it will capsize when the wind and waves come; if the position is appropriate, it can weather the storm.
3. Opening Logic:
Refers to "why go long/short"?
Is it a technical pattern? News? Chip structure? It must have a basis, not a "feeling."
4. Entry Point:
Only consider "where to enter" after the logic is established.
Is it a breakthrough? Stepping back? End of consolidation? The logic must be clear, and the points must be disciplined.
5. Stop Loss Point Setting:
Where should you retreat from when the market betrays you?
The stop loss point is not the point you are "willing to lose," but where your trading logic is broken.
6. Take Profit Strategy:
Profit is not paper wealth, but must be truly "pocketed."
Including fixed point take profit, profit-loss ratio take profit, moving take profit and other methods.
7. Position Adding/Reducing Mechanism (Optional):
Whether to add to a winning position? Whether to reduce positions at key points to protect profits?
These are the "advanced" parts of the system, but still need to be included in the overall closed loop for consideration.
A closed-loop system can traverse cycles, control emotions, and continuously profit.
The trading world is full of uncertainty, and the meaning of a closed-loop system is to firmly control the certain parts and hand over the uncertain parts to probability and risk control.
Just like driving a car, you can't control how many curves there are ahead, but you can control the speed, pull the handbrake, and buckle your seatbelt.
The closed loop of the trading system is your navigation + brakes + airbags when driving in a chaotic market.
Stop thinking that knowing a few indicators is a trading system. The real way to trade is to establish a closed-loop strategy that can withstand the triple test of time, emotions, and losses.
May you tame the beast within, put on the armor of strategy, survive on the battlefield of the market, and win.
That complete trading system has seven links: make up for whichever link you are missing. Stop being obsessed with those indicators that look "high-end."
What really determines whether you can survive and stably profit in trading is never the technology itself, but:
Understanding of the market.
Understanding of human nature.
And absolute execution of the system.
Indicators are the skin, the system is the bones, and cognition and psychology are the soul.
Welcome to follow the official account (Chain on Rui Qian), you can watch real trading for learning and communication, and you can also clearly understand the direction and strategy of the market. No matter what the market style is, if you know in advance, you will have time to better grasp it!!!
The following are trading strategies with a win rate of over 80%. I spent 2 years, hundreds of days and nights, drawing thousands of charts, and researching and summarizing these top trend continuation chart patterns.
A simple and easy-to-understand range-bound price action trading strategy.
I like to keep everything simple and clear, and range-bound trading is no exception.
Range-bound trading refers to the price being trapped between a support level and a resistance level, oscillating back and forth between these two boundaries.
Below is a chart of a typical range-bound market...
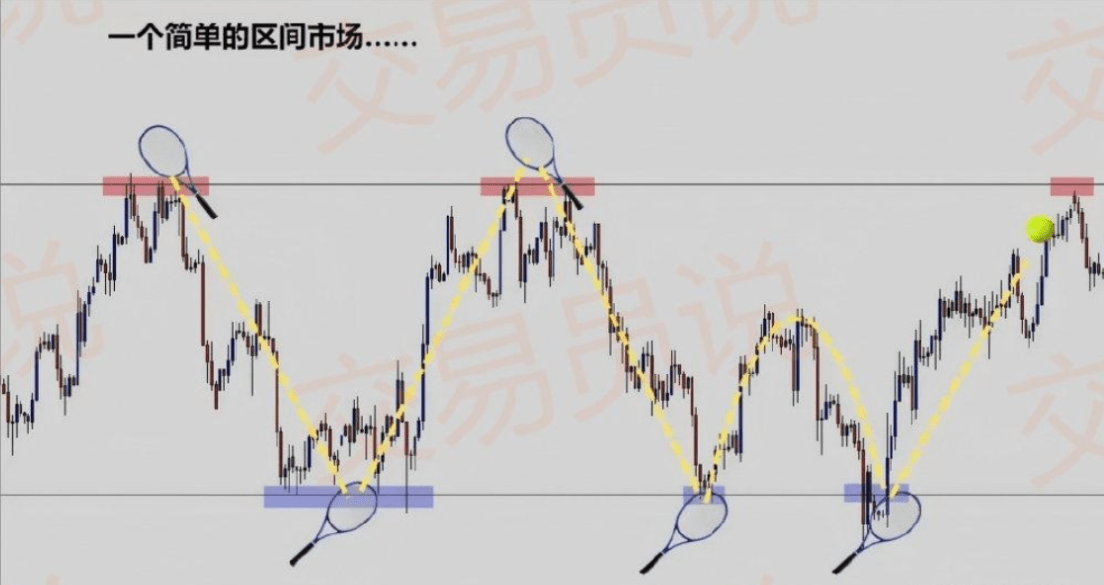
The best approach is to focus on the upper and lower boundaries, looking for price action signals that suggest the price is about to rebound.
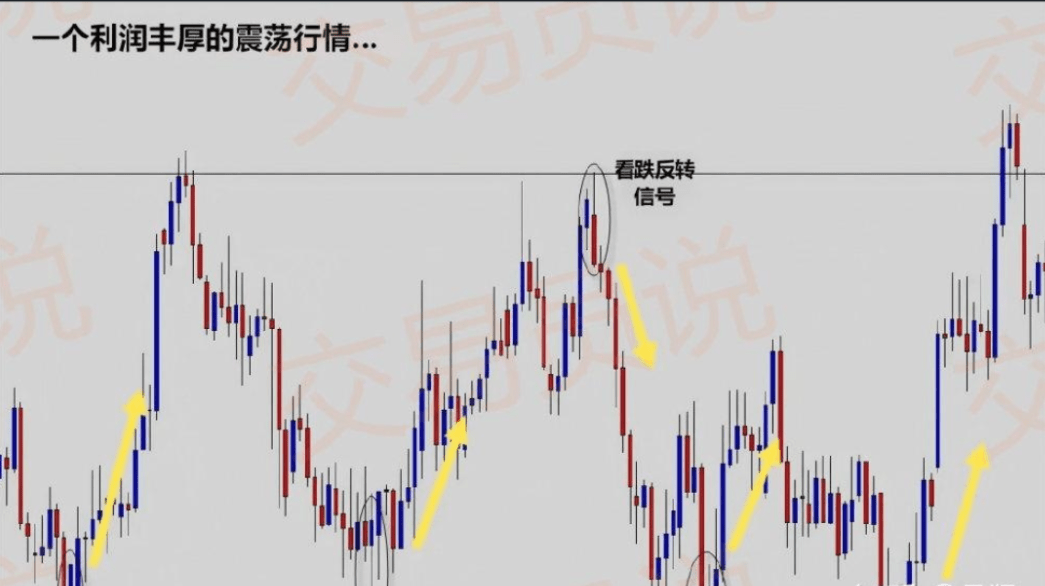
Let's take a look at this example of a range-bound market:
You can clearly see that this is a range-bound market because there are two clear boundaries in the chart, and the price runs back and forth between the two.
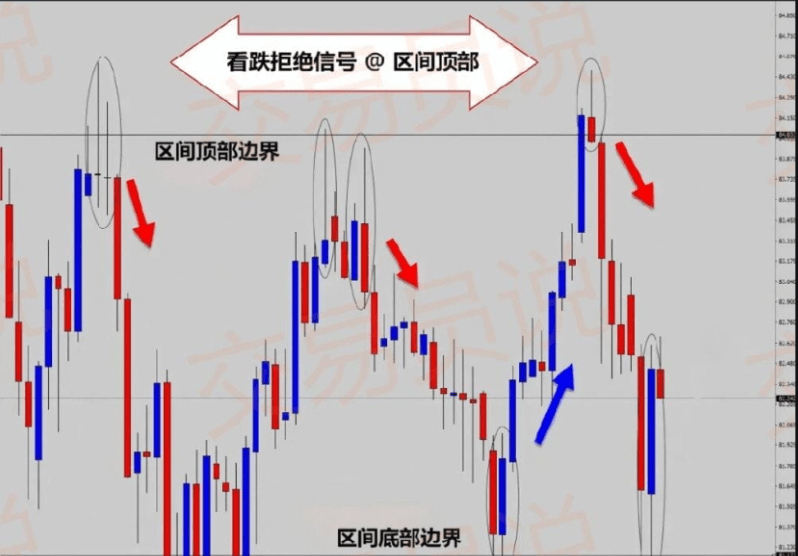
Please note: Multiple bearish rejection signals appear at the upper boundary, while multiple bullish rejection signals appear at the lower boundary - these signals all indicate that the price may rebound at the boundaries.
These signals are early warning signs of a new range-bound cycle.
In the figure above, I captured the moment when a large bullish rejection signal appeared at the bottom of the range. Which direction do you think the price will move next?
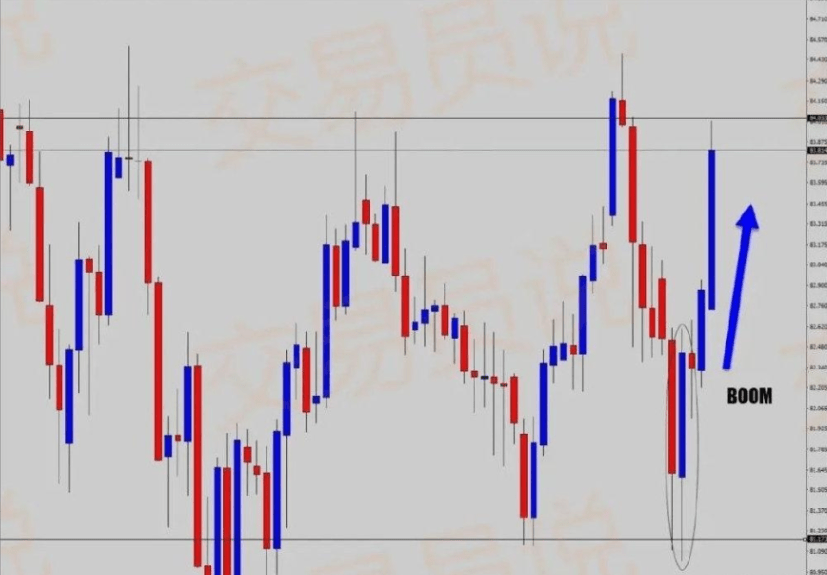
If you guessed "up," then you're great.
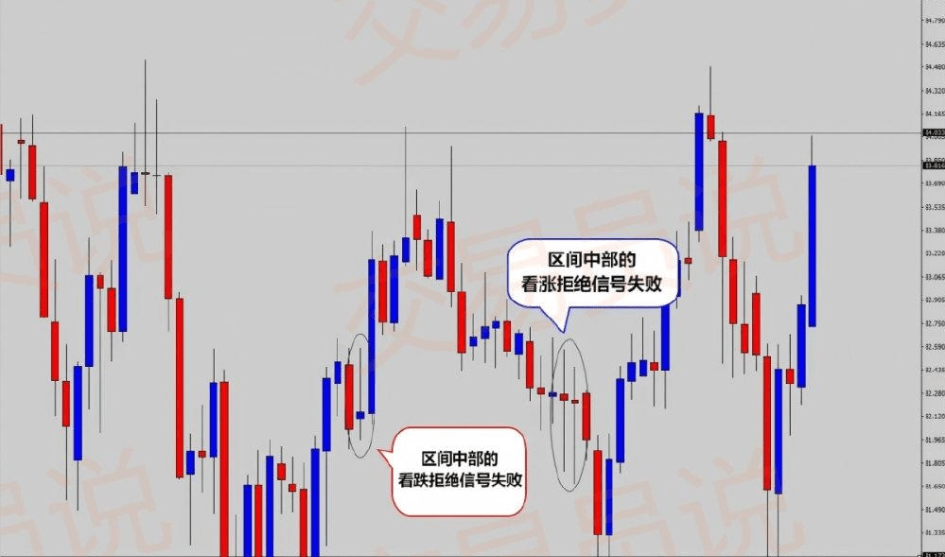
It's that simple - you just need to trade at the boundaries of the range to get the best trading opportunities. Trying to trade the "breakout" of a range-bound market is another matter! It's difficult - the market often deceives you near the range boundaries, making you think it's going to break through, but it doesn't.
This situation is called a false breakout, also known as a "fake move." It is very common at the top and bottom of the range, and even experienced traders are easily fooled - so focus on the "rebound" opportunities trading range boundaries.
What about in the middle of the range? Wow, be careful - it's a minefield...
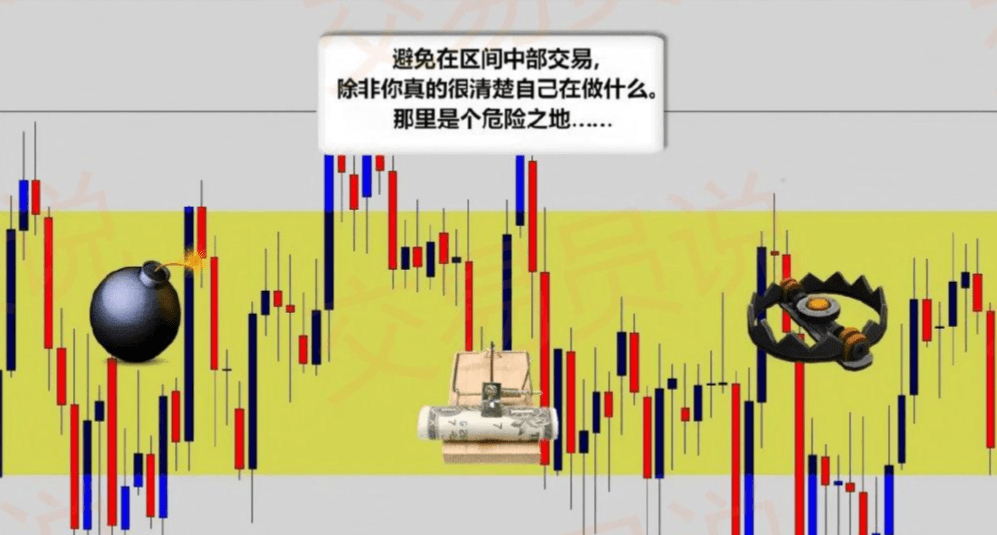
Take a look at the following signals in the middle of the range...
When you trade in the middle of a range, it's like dancing in the fire.
Range-bound trading itself is very simple, don't complicate it.
Range-bound trading is a simple market structure. When you are looking for range-bound trading opportunities, you are looking for evidence that the price intends to rebound at the top or bottom of the range. Bullish rebound signals appear at the bottom, and bearish rebound signals appear at the top. Do not easily get involved in the middle area of the range - it is a dangerous minefield!
The secret to identifying trends, and how to trade with the trend.
How to judge market trends? This is a question that is often over-analyzed and taken out of context, especially in various public discussions.
Due to the chaos and disagreements, no one can give a definite answer. But the answer is actually here:
What you need to observe is the trajectory of the swing highs and lows of the price.
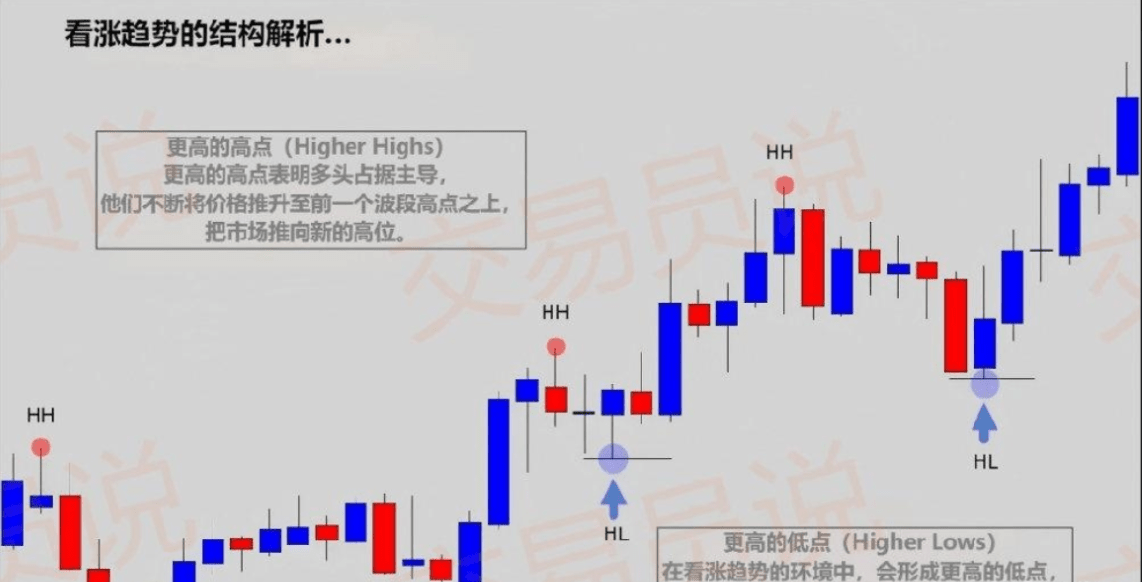
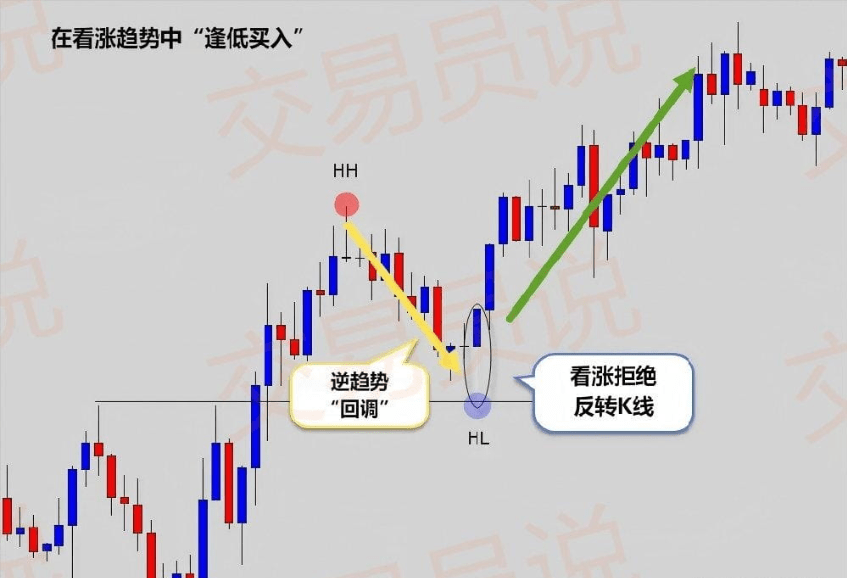
A rising market will form higher highs (HH) and higher lows (HL).
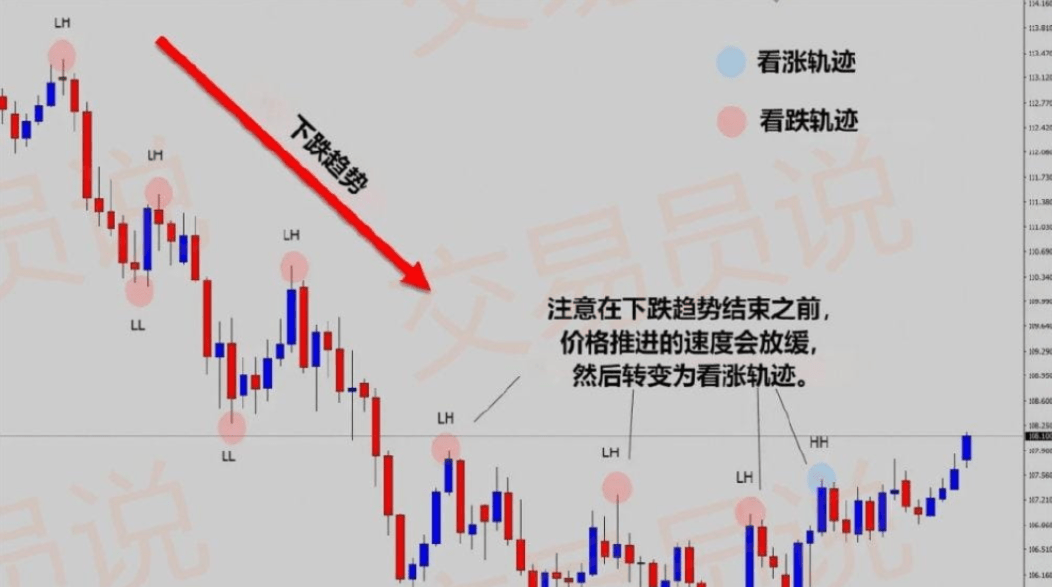
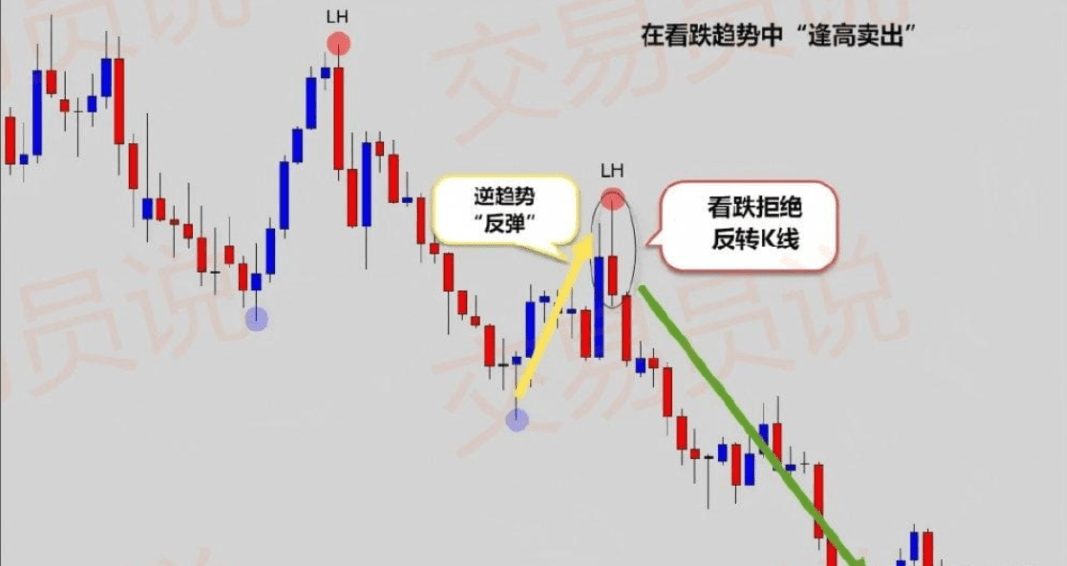
A falling market will form lower highs (LH) and lower lows (LL).
Bullish Trend Structure:
Bearish Trend Structure:
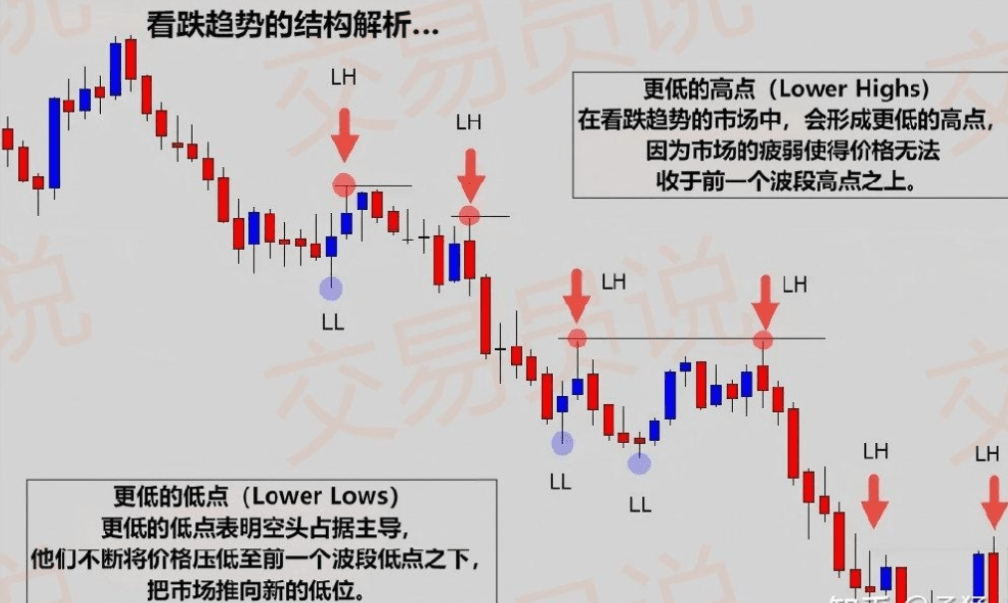
If you don't see this structure on the chart, then the market has either stopped trending, or it was never in a trend to begin with.
You can also identify possible trend reversals by observing these "swing turning points"...
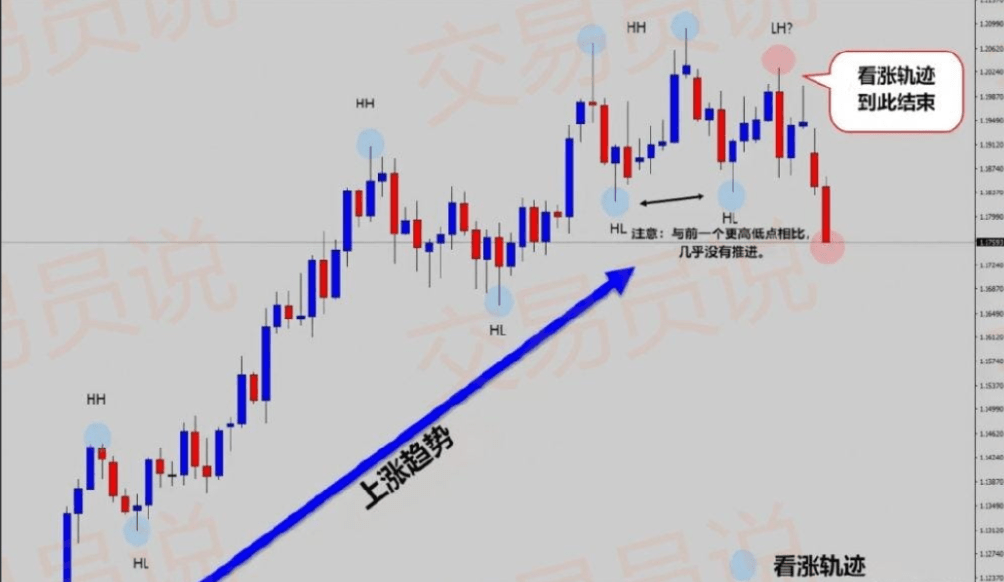
As shown in the figure, the price action here defines a standard uptrend condition through a structure of higher lows + higher highs.
But also pay attention to the warning signs - it can be observed in the figure that the rising rhythm of highs and lows is slowing down, which indicates that the trend may be weakening.
After the trend slows down, signs of weakness begin to appear in the price action. Hmm... is there a sign of a bearish trend starting? These first-hand signals are what you need to pay attention to.
Being able to recognize these subtle structural changes will make you stand out among many technical analysts - because almost no one pays attention to these key details!
For better understanding, let's look at an example of a bearish trend:
I have found that many traders like to use various indicators to judge the direction of the trend - in fact, it is not necessary at all, the most critical information is in the chart itself.
Swing structure analysis not only helps you determine whether a trend exists, but also helps you identify trend strength and potential reversal hotspots.
Now, "identifying trends" has never been easier!
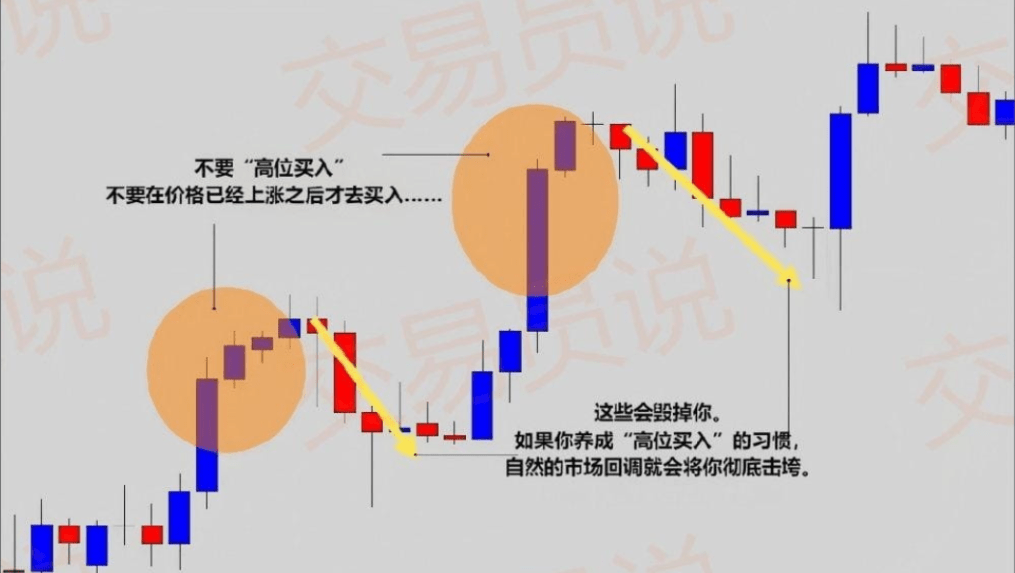
The "golden rule" of trading is "buy low and sell high." It sounds simple, but why are so many traders always buying at extreme highs or selling at extreme lows?
When traders do the opposite (buy high and sell low), the following happens:
Buying high in an uptrend → being trapped at the top.
Chasing shorts at low positions in a downtrend → smashing on the floor.
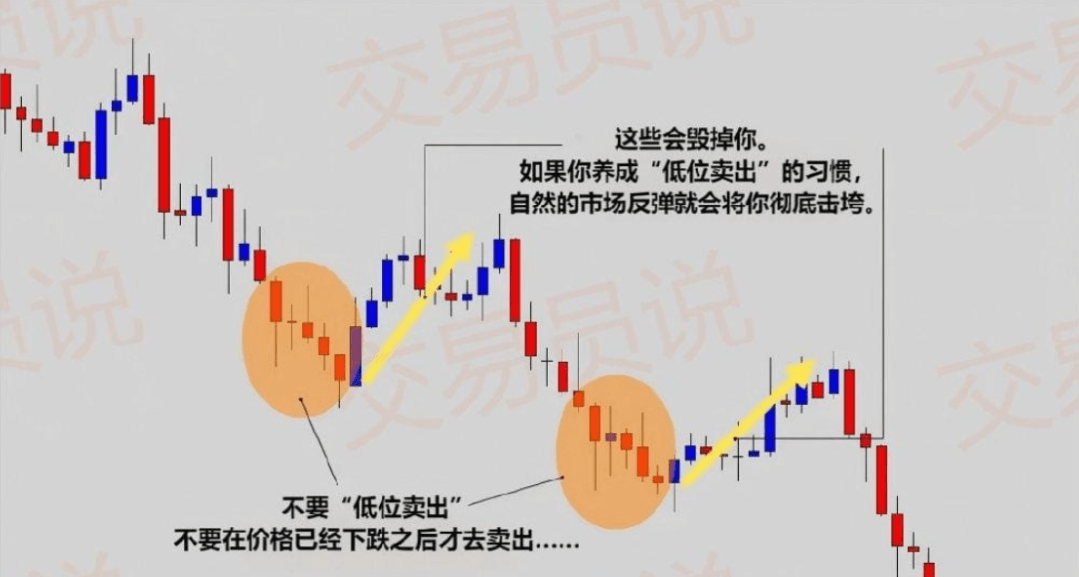
Please remember the classic saying: "Buy the dips in an uptrend, sell the rallies in a downtrend."
This widely circulated trading proverb accurately summarizes how to correctly layout in a trend, while avoiding the risk of being swept out by a pullback.
If the market is in a downtrend, a brief rally is your short opportunity; if the market is in an uptrend, a brief pullback is your long opportunity.
Example chart:
Buy the dips in an uptrend.
Sell rallies in a downtrend.
Sometimes, going back to basics is the most important thing. You need to truly understand what a trend is.
This is precisely why price action is the best way to assess market structure, you can tell at a glance whether the market is in a trend.
Trends are actually very simple - like a stepped market structure. You don't need a bunch of strange indicators to tell you the direction, just use the trend identification rules mentioned in this lesson to judge the trend state yourself.
Summary.
You don't need any indicators to judge the trend! All the answers are in the price action itself, and it's not difficult to read.
The main reason traders fail to enter the market is that they cannot correctly judge whether the market is in a trend; or they trade signals in the "wrong position" in the trend. Please use swing structure analysis to determine whether the market is in a trend, the direction of the price, and the strength of the trend.
Finally, remember this golden rule: "Buy low in an uptrend, sell high in a downtrend."
Many people who start trading contracts only have 10,000 funds (approximately equal to 1400U) and think "the principal is small, just do it." But the truth is: the smaller the funds, the more position management is needed.
Large funds can rely on time to survive, and small funds rely entirely on discipline. Otherwise, one liquidation will have to recharge "faith."
The following set of methods is suitable for contract players with funds between 5,000 and 20,000 RMB, and the goal is not to double in one day, but to have low drawdowns and steady growth.
1. Core Objective: Not getting rich overnight, but steady compounding.
Small funds for contracts are not for earning a BMW per order, but for earning a phone case every month, and 12 consecutive times turns into an iPhone.
Compounding rhythm:
Monthly target return: 10%~20%
Control the maximum single loss to be no more than 2% of the total account funds.
Swing holding, allowing 1-5 days, adjusting stop loss in the middle.
2. Four-step method for small fund position management
Step One: Divide the account into sections and delineate the "battle fund pool."
Account: 10000 yuan ≈ 1400U.
Divide into 4 transaction segments, each with 350U.
Only trade one section, and don't move the other sections.
The essence is to give yourself 4 lives, there is salvation if you are wrong.
Benefits: Resists continuous stop losses, and will not lose all ammunition at once.
Step Two: Control each risk within 1%-2% of the total funds.
Recommended practice: Control the stop loss amount for a single transaction to be within 140U (about 10%).
For example, trading BTC:
Difference between entry point and stop loss point = 500USDT.
Using 10x leverage is a fluctuation of 50USDT.
In order not to exceed 140U risk, you can only open a maximum of 2.8 BTC contracts ≈ 3.
→ This is the process of reverse reasoning the position.
Remember one sentence: It's not how many you want to open, but how many the market allows you to open.
Step Three: Pyramid adding positions, only enlarge positions when making money.
If you go long from a low position and have a floating profit of 100U, you can consider:
Add a portion to continue eating the trend upwards.
Raise the stop loss to the breakeven or even profitable area.
The remaining part is free to attack, and risk control has protected itself.
This way, even if the market retraces, you can retreat unscathed.
Only add positions when there is floating profit, do not add positions when there is a loss!
Step Four: Grade the market and decide on the position size.
Market Type Position Suggestions Example Illustration Vague Oscillation Empty Position or Extremely Small Position, etc. Clear Direction Before Going Up Clear Breakout Half Position Entry Support/Resistance Confirmed Breakout Trend Acceleration Full Position + Adding Positions Strong Momentum, Chasing Acceleration Wave High Level Stagnation/Divergence Reducing Positions or Taking Profit to Protect Profits, Avoid Reversal
This is the "market rating - position allocation" thinking. The market decides first, not the position.
3. Additional Notes for Crypto Contract Trading
1. Leverage suggestion: no more than 20 times (here I mean the total leverage ratio of the account).
Leverage does not amplify profits, but amplifies mistakes.
High leverage is suitable for short-term masters, not for swing holding.
2. Transaction fees have a huge impact.
It is recommended to choose a large platform and a commission link, and do not trade frequently on a high commission platform.
Transaction fees will eat up most of the profits from your small fund compounding.
3. When the volatility is extremely high, reduce positions or even wait and see.
Halve your position when big news comes out or there is extreme volatility.
Small accounts have poor pressure resistance and are most afraid of large yin and yang sweeps back and forth.
4. A practical example: use 350U to break through a wave of market.
Coin Selection: DOT breaks through the box independent structure and stands on the key platform/UNI breaks through the trend line/WOO constantly raises the bottom and forms a rising structure in the box/BTC has not fallen below 107200 for a long time and forms a new independent structure, which meets the entry standards in the trading system.
Entry: Break through the platform and step back to confirm the right side entry, break through the box on the left side entry, break through the important trend line, left side entry.
Stop loss: Set the stop loss at the lower edge of the platform, and control the risk within 100U.
Add positions: When the price breaks through the structural position or a trend K-line appears, add half of the position when the K-line pulls back, and move the stop loss to the cost.
Reduce positions: When the price rises sharply or is close to the previous high/resistance position, take profit in parts.
After a wave of play, the account grew by nearly 500%. This is the path that small contract funds should take - not greedy, not cowardly, and not rushing around.
5. Small positions are your martial arts secret, not shackles.
Small funds are not a problem, misuse of positions is the problem. You are not losing on skills, but dying on liquidation. When the position is stable, the emotions are stable, and the operation is stable.
Remember this sentence: "Being able to win a bet is ability; being able to lose a bet is a system."


