Popular science on technical analysis indicators in the cryptocurrency circle
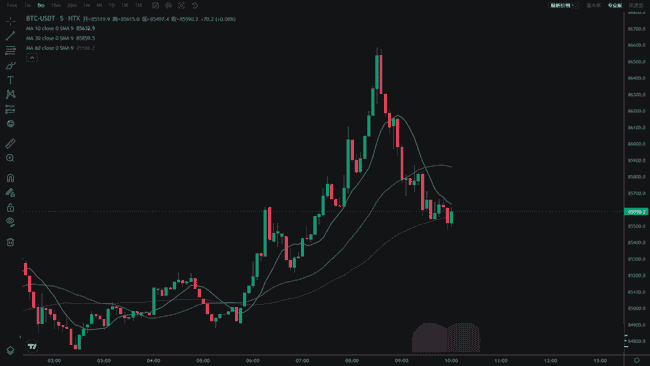
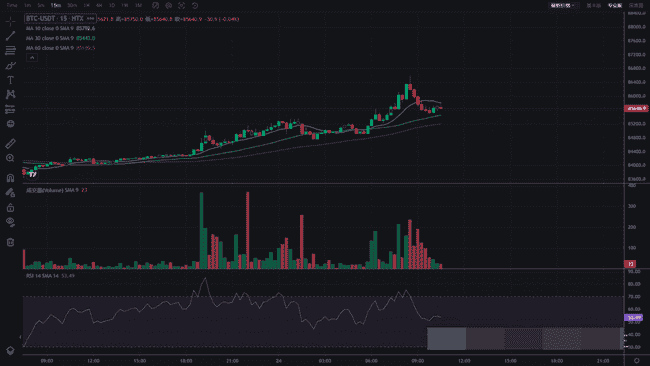
1. Moving Average (MA): A tool for trend judgment
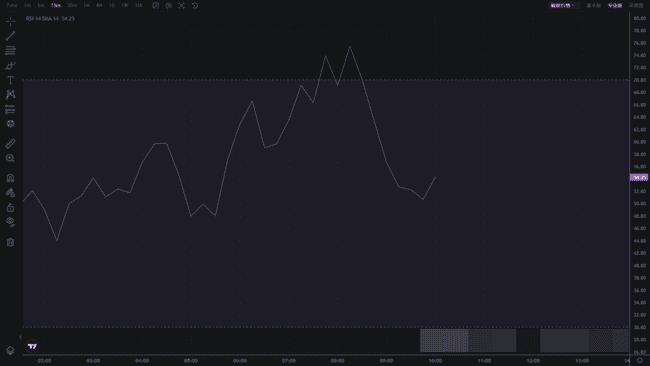
2. Relative Strength Index (RSI): Overbought and oversold signals
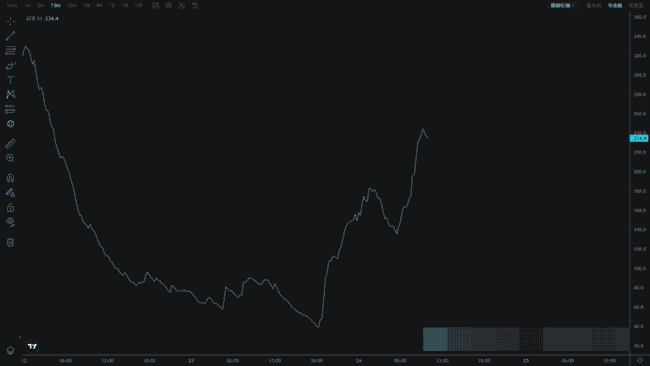
3. Average True Range (ATR): Volatility indicator
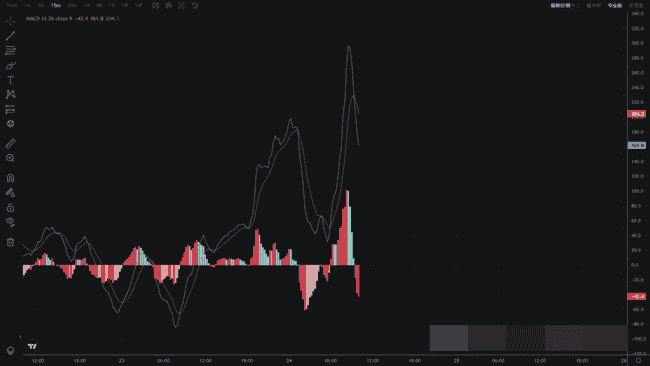
4. MACD Indicator: Dual validation of momentum and trend
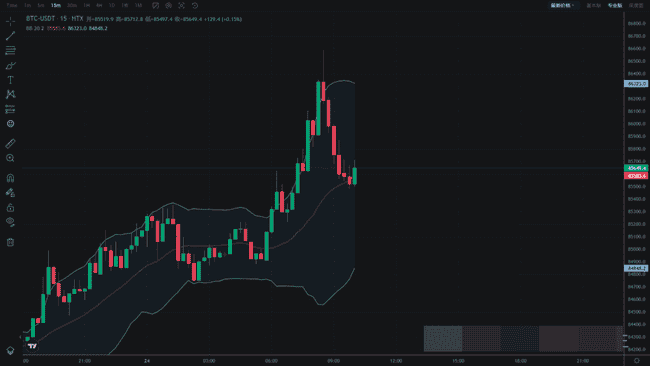
5. Bollinger Bands: Price volatility range
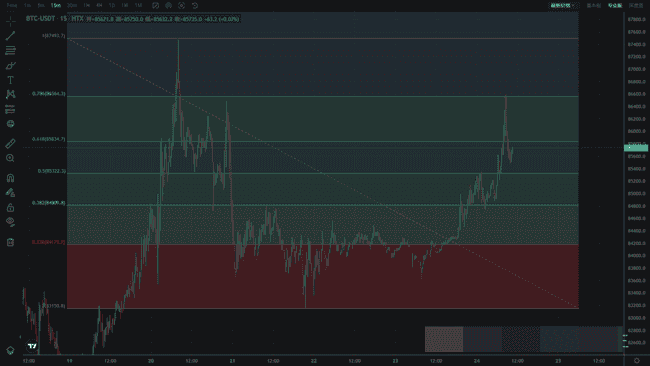
6. Fibonacci Retracement: Finding support and resistance
Definition: Determine support and resistance levels for price retracement based on the golden ratio (such as 0.382, 0.5, 0.618, etc.).
Application Skills:
In an uptrend, a pullback to the 0.618 range may provide buying opportunities;
In a downtrend, a rebound to the 0.382 range may form a sell signal.
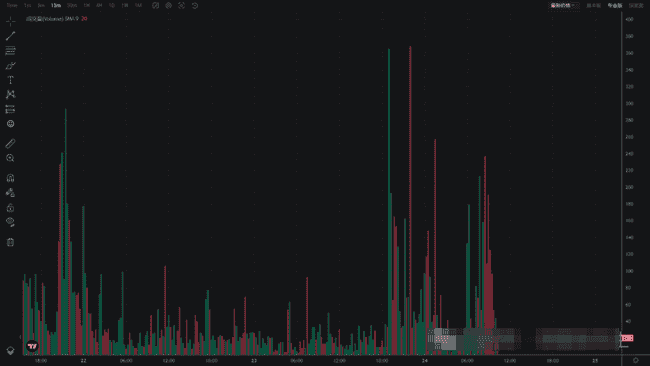
7. Volume Indicator: Key to validating trends
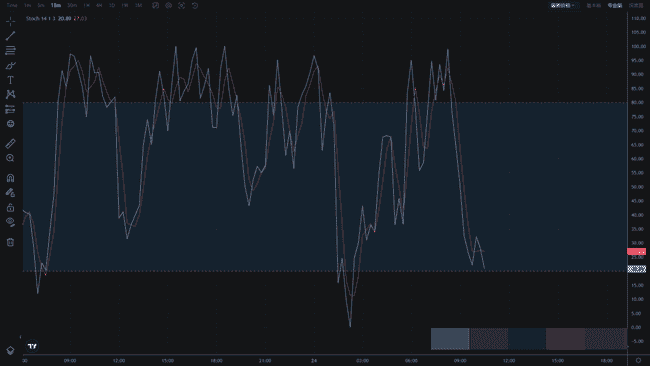
8. KD Indicator: Capturing short-term buying and selling opportunities
02
—
Practical Skills: Indicator combinations help you establish yourself in the cryptocurrency circle
Single indicators often have limitations; it is recommended to combine multiple indicators in actual trading:
 Still the same thing, if you don't know what to do in a bull market, click on Awen's avatar, follow, and get plans for spot trading in a bull market, contract passwords, and free sharing.


