Bitcoin (BTC), Ethereum (ETH), and Ripple (XRP) are all stagnating as the excitement in the cryptocurrency market weakens. BTC and XRP are currently weakening around important support levels of 116,000 USD and 2.99 USD respectively, while ETH is still struggling to overcome the resistance level of 4,488 USD. Momentum indicators are all issuing warning signals, indicating the risk of the market entering a deeper correction.
Bitcoin may extend its decline if it breaks the support level of 116,000 USD
Bitcoin has just set a new historical peak at 124,474 USD on Thursday, but the upward momentum could not be sustained for long as the price quickly adjusted downwards by 4% on the same day. By the weekend, BTC mainly fluctuated around the 117,300 USD range. Moving into this week, selling pressure remains, causing the price to continue to weaken on Monday, slipping slightly below the key support level of 116,000 USD.
If Bitcoin closes below the level of 116,000 USD on the daily frame, the downtrend could extend, with the goal of testing the 50-day exponential moving average (EMA) at 115,031 USD. Breaking this level would open up the risk of deeper declines towards the next support zone around 111,980 USD.
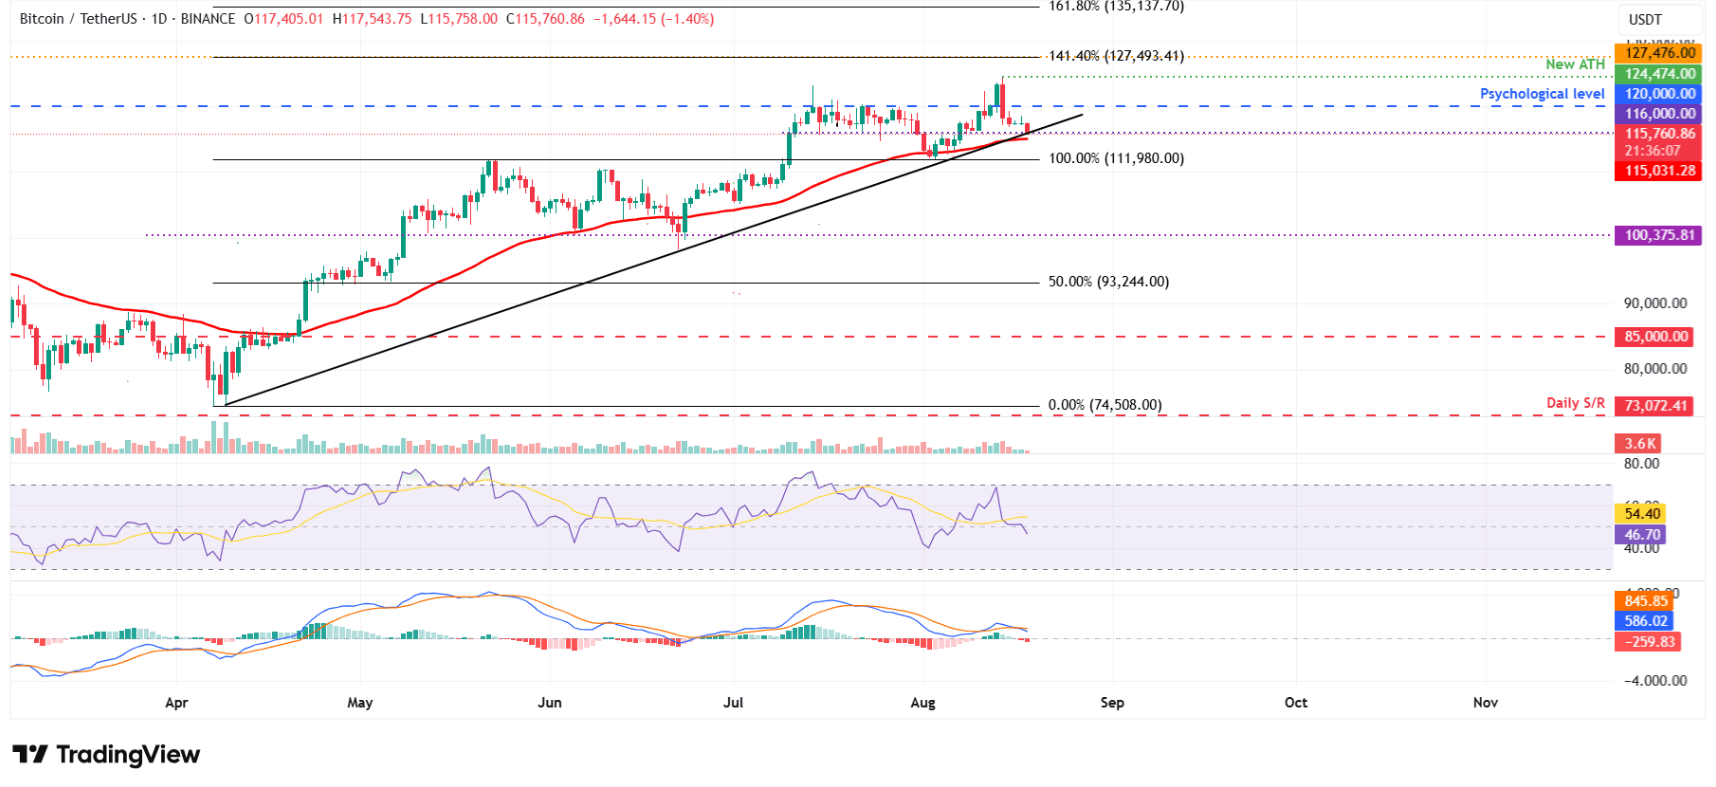
Technical indicators are also leaning towards a bearish scenario. The RSI indicator on the daily chart has fallen below the neutral level of 50 and continues to decline, reflecting increased selling pressure. Meanwhile, the MACD showed a bearish crossover on Sunday, issuing a sell signal and reinforcing the risk of a downward trend.
However, if BTC regains the level of 116,000 USD, the market could witness a recovery phase, with the goal of returning to the psychological level of 120,000 USD.
Ethereum faces the risk of a correction
Ethereum recorded a new yearly high at 4,788 USD on Thursday, just a short distance from the historical record of 4,868 USD. However, the rapid increase quickly stalled as the price plummeted nearly 7% on Saturday. By Sunday, ETH bounced back slightly but continued to fail at the resistance level of 4,488 USD. As of the beginning of the week, this cryptocurrency remains in a weakening trend, fluctuating around 4,364 USD.
If the correction pressure is maintained, ETH may retreat deeply to the important support zone at 3,946 USD.
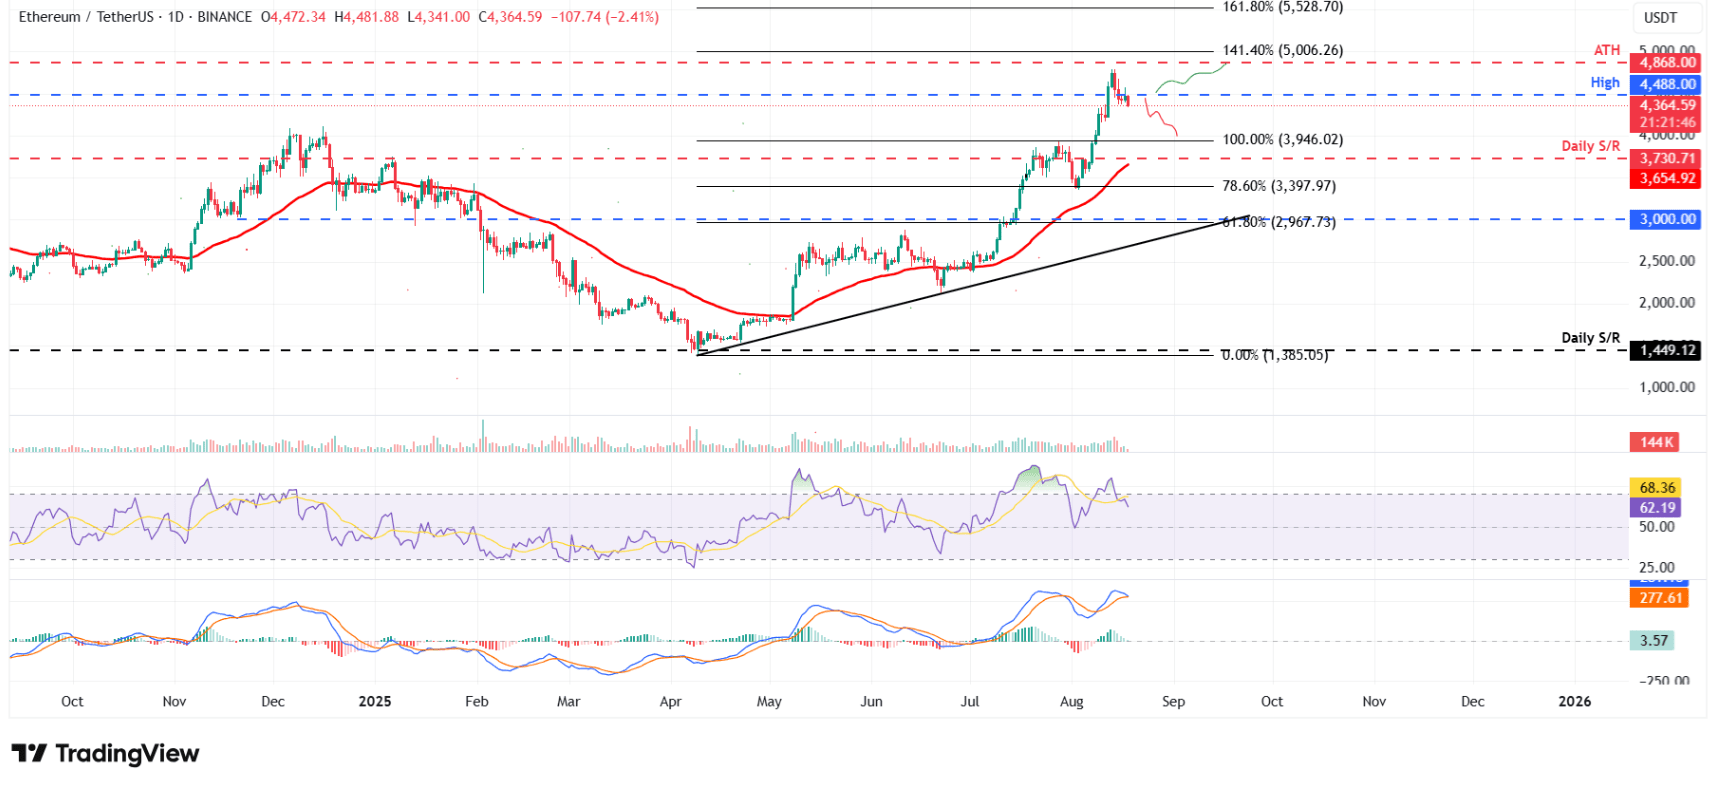
Technical indicators are also leaning towards a bearish scenario: the RSI on the daily frame is at 62, leaving the overbought zone from last week and now trending down, reflecting that the upward momentum has weakened. Meanwhile, the moving averages of the MACD indicator are gradually converging and are at risk of soon creating a bearish crossover, further reinforcing the risk of a correction.
Conversely, a positive scenario would open up if ETH recovers and closes above 4,488 USD, in which case the upward trend could be extended, even bringing the price back to challenge the historical peak of 4,868 USD.
XRP shows a clear sign of weakness
Ripple (XRP) failed to break through the resistance level of 3.40 USD on Thursday, causing the price to plummet nearly 6% by the weekend. As of Monday, this cryptocurrency remains in a downtrend, approaching the key support level of 2.99 USD.
If XRP closes below the level of 2.99 USD, selling pressure may continue to push the price down to the next support zone at 2.72 USD. Important technical indicators such as RSI and MACD are currently also reinforcing this bearish scenario, similar to what is happening with Bitcoin.
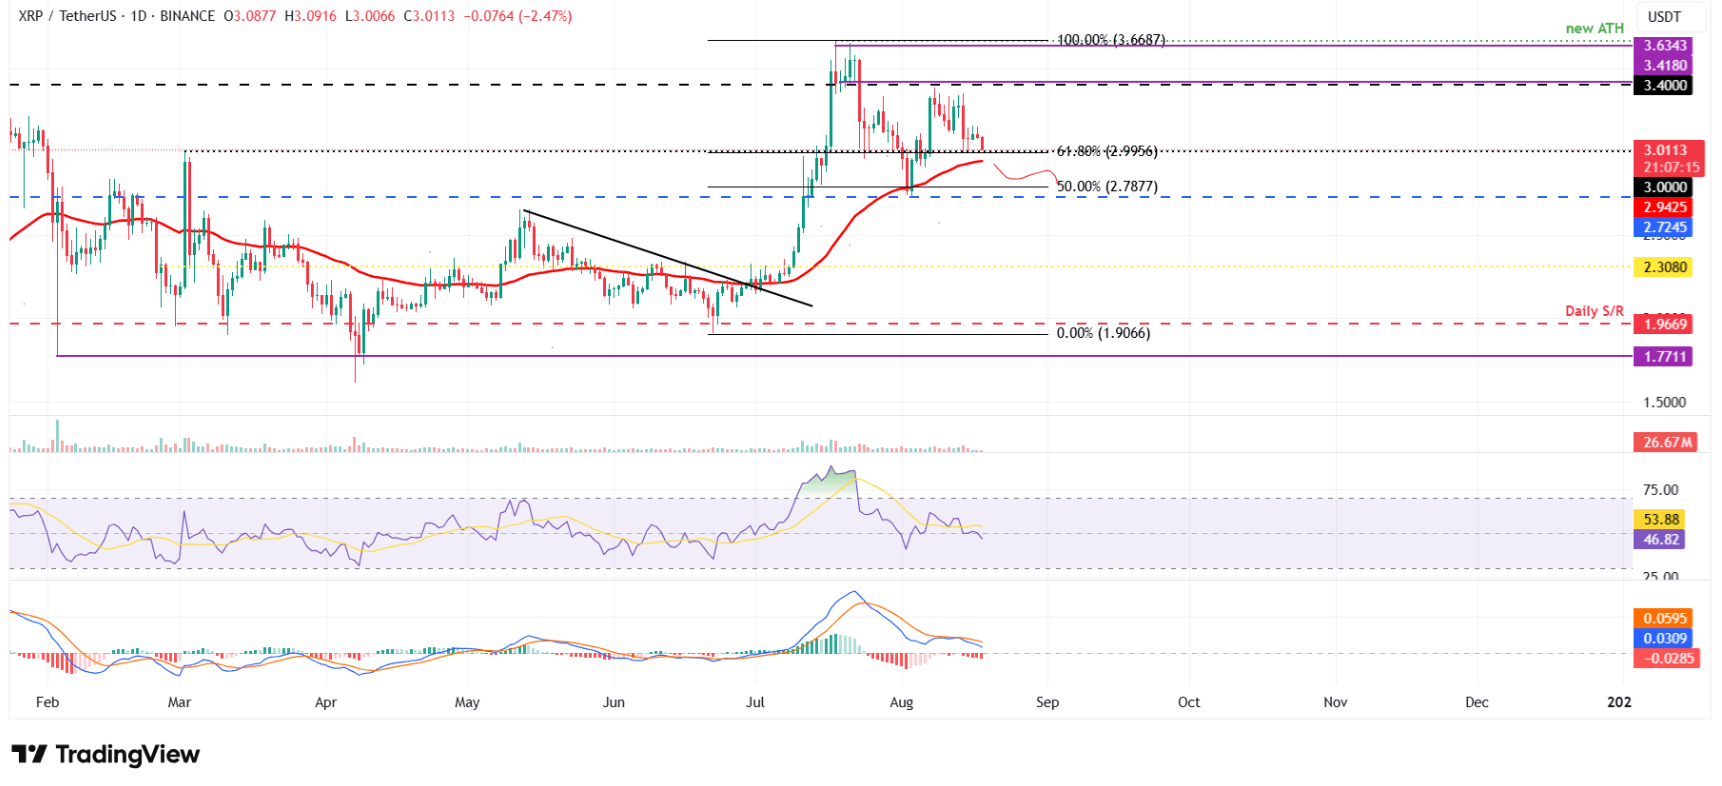
However, in the event that XRP holds the 2.99 USD level, the chance of bouncing back and testing the 3.40 USD level is not completely closed.
