The Dogecoin to USD exchange rate has fallen below the $0.250 region, initiating a new round of decline. Dogecoin is currently in a consolidation phase and may further drop below $0.2250.
DOGE price has started to decline again, breaking below $0.2420.
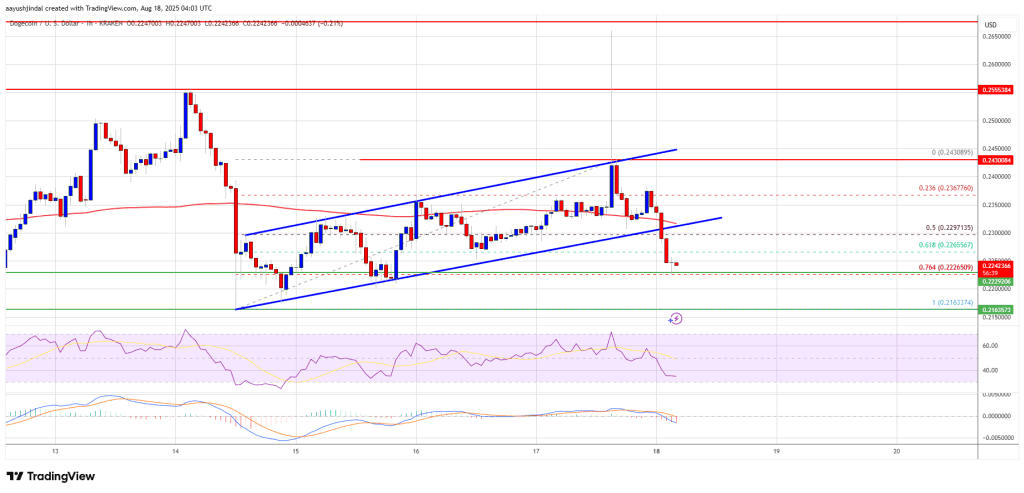
The price is below the $0.2320 level and the 100-hour simple moving average.
On the hourly chart for DOGE/USD, it has broken below the key upward channel, with support at $0.2295 (data source: Kraken).
If the price stays above the $0.2165 area, it may begin a new round of increase.
Dogecoin price has dropped again
Dogecoin's price has started to rise again above the resistance level of $0.240, similar to Bitcoin and Ethereum. Before the bears appeared, Dogecoin even soared above $0.2420.
The price formed a high at $0.2430 and then began a new round of decline, breaking below the levels of $0.240 and $0.2350. The price has broken below the 50% Fibonacci retracement level of the upward move from the low of $0.2163 to the high of $0.2430.
Additionally, the Dogecoin/USD hourly chart shows that it has broken below the key upward channel, with support at $0.2295. The Dogecoin price is currently below $0.2320 and the 100-hour simple moving average.
Bulls are currently defending the 76.4% Fibonacci retracement level of the upward move from the low of $0.2163 to the high of $0.2430. If a recovery wave occurs, the immediate resistance level is around $0.2295. The first major resistance for bulls may be near $0.2320.
 The next major resistance level is around $0.2420. If the closing price breaks above the $0.2420 resistance level, it may push the price to the $0.250 resistance level. If it rises further, it may push the price to $0.2650. The next major stop-loss for bulls may be at $0.2780.
Will DOGE's losses become even greater?
If the Dogecoin price fails to break above $0.2320, it may continue to decline. The initial support level on the downside is around $0.2220. The next major support level is near $0.2165.
Major support level at $0.2150. If the support level of $0.2150 is broken, the price may decline further. In this case, the price could drop to $0.2050 or even $0.2020 in the short term.
Technical indicators
Hourly MACD - The MACD for DOGE/USD is currently gaining momentum in the bearish zone.
Hourly RSI (Relative Strength Index) - The RSI for DOGE/USD is currently below the 50 level.
Major support levels - $0.2165 and $0.2150.
Major resistance levels - $0.2320 and $0.2420.


