On Monday (August 18), as the Asian trading session began, Bitcoin attempted to rebound and stabilize at the $115,000 level, while market volatility sharply declined before Federal Reserve Chair Powell's speech at Jackson Hole. Investors are generally betting on a rate cut in September, but some warn that the market's complacency may mask risks.
Bitcoin has broken the high-level consolidation pattern and is currently retreating to the vicinity of $115,000, trying to stabilize at this level.
Bitcoin fell from $124,000 to a low of $118,000, leading to over $1 billion in liquidations in the crypto derivatives market, the largest long liquidation since early August this year. Analysts believe this is more about profit-taking rather than a trend reversal, but it also highlights the market's vulnerability when leverage accumulates quickly.
Meanwhile, Ethereum is quoted at $4,524.10, up 2.13% for the day. The size of Ethereum exiting staking has reached a record $3.8 billion, with a waiting time of 15 days. Despite strong ETF and institutional fund demand, this could still lead to profit-taking pressure.
Galaxy analysts noted that there are clear signs of pressure in the market:
ETH borrowing costs are rising: Aave saw a wave of withdrawals in July, pushing Ethereum borrowing rates above staking yields, undermining the popular 'circular leverage' strategy (using staked ETH as collateral to borrow more ETH). This resulted in a rapid exit from staking positions, leading to a record 13-day waitlist for exiting the Ethereum Beacon Chain.
USDC financing costs are rising: Since July, OTC USDC lending costs have been steadily increasing, while on-chain lending rates have remained stable. The spread between the two has widened to the highest level since the end of 2024, indicating that off-chain dollar demand far exceeds on-chain liquidity. If the market tightens further, this mismatch could exacerbate volatility.
Despite institutional demand and ETF inflows continuing to support an overall bullish backdrop, the system has exposed more pressure points due to the expansion of loan sizes, concentration of borrowing power, tightening DeFi liquidity, and the widening gap between on-chain and off-chain dollar markets.
Galaxy warned that the $1 billion liquidation last Thursday is a signal — the return of leverage could both drive the market and amplify risks.
A 'calm' before the Federal Reserve's Jackson Hole meeting
As traders await Federal Reserve Chair Powell's speech at the Jackson Hole annual meeting on August 21-23, major global asset classes have entered a period of 'calm'.
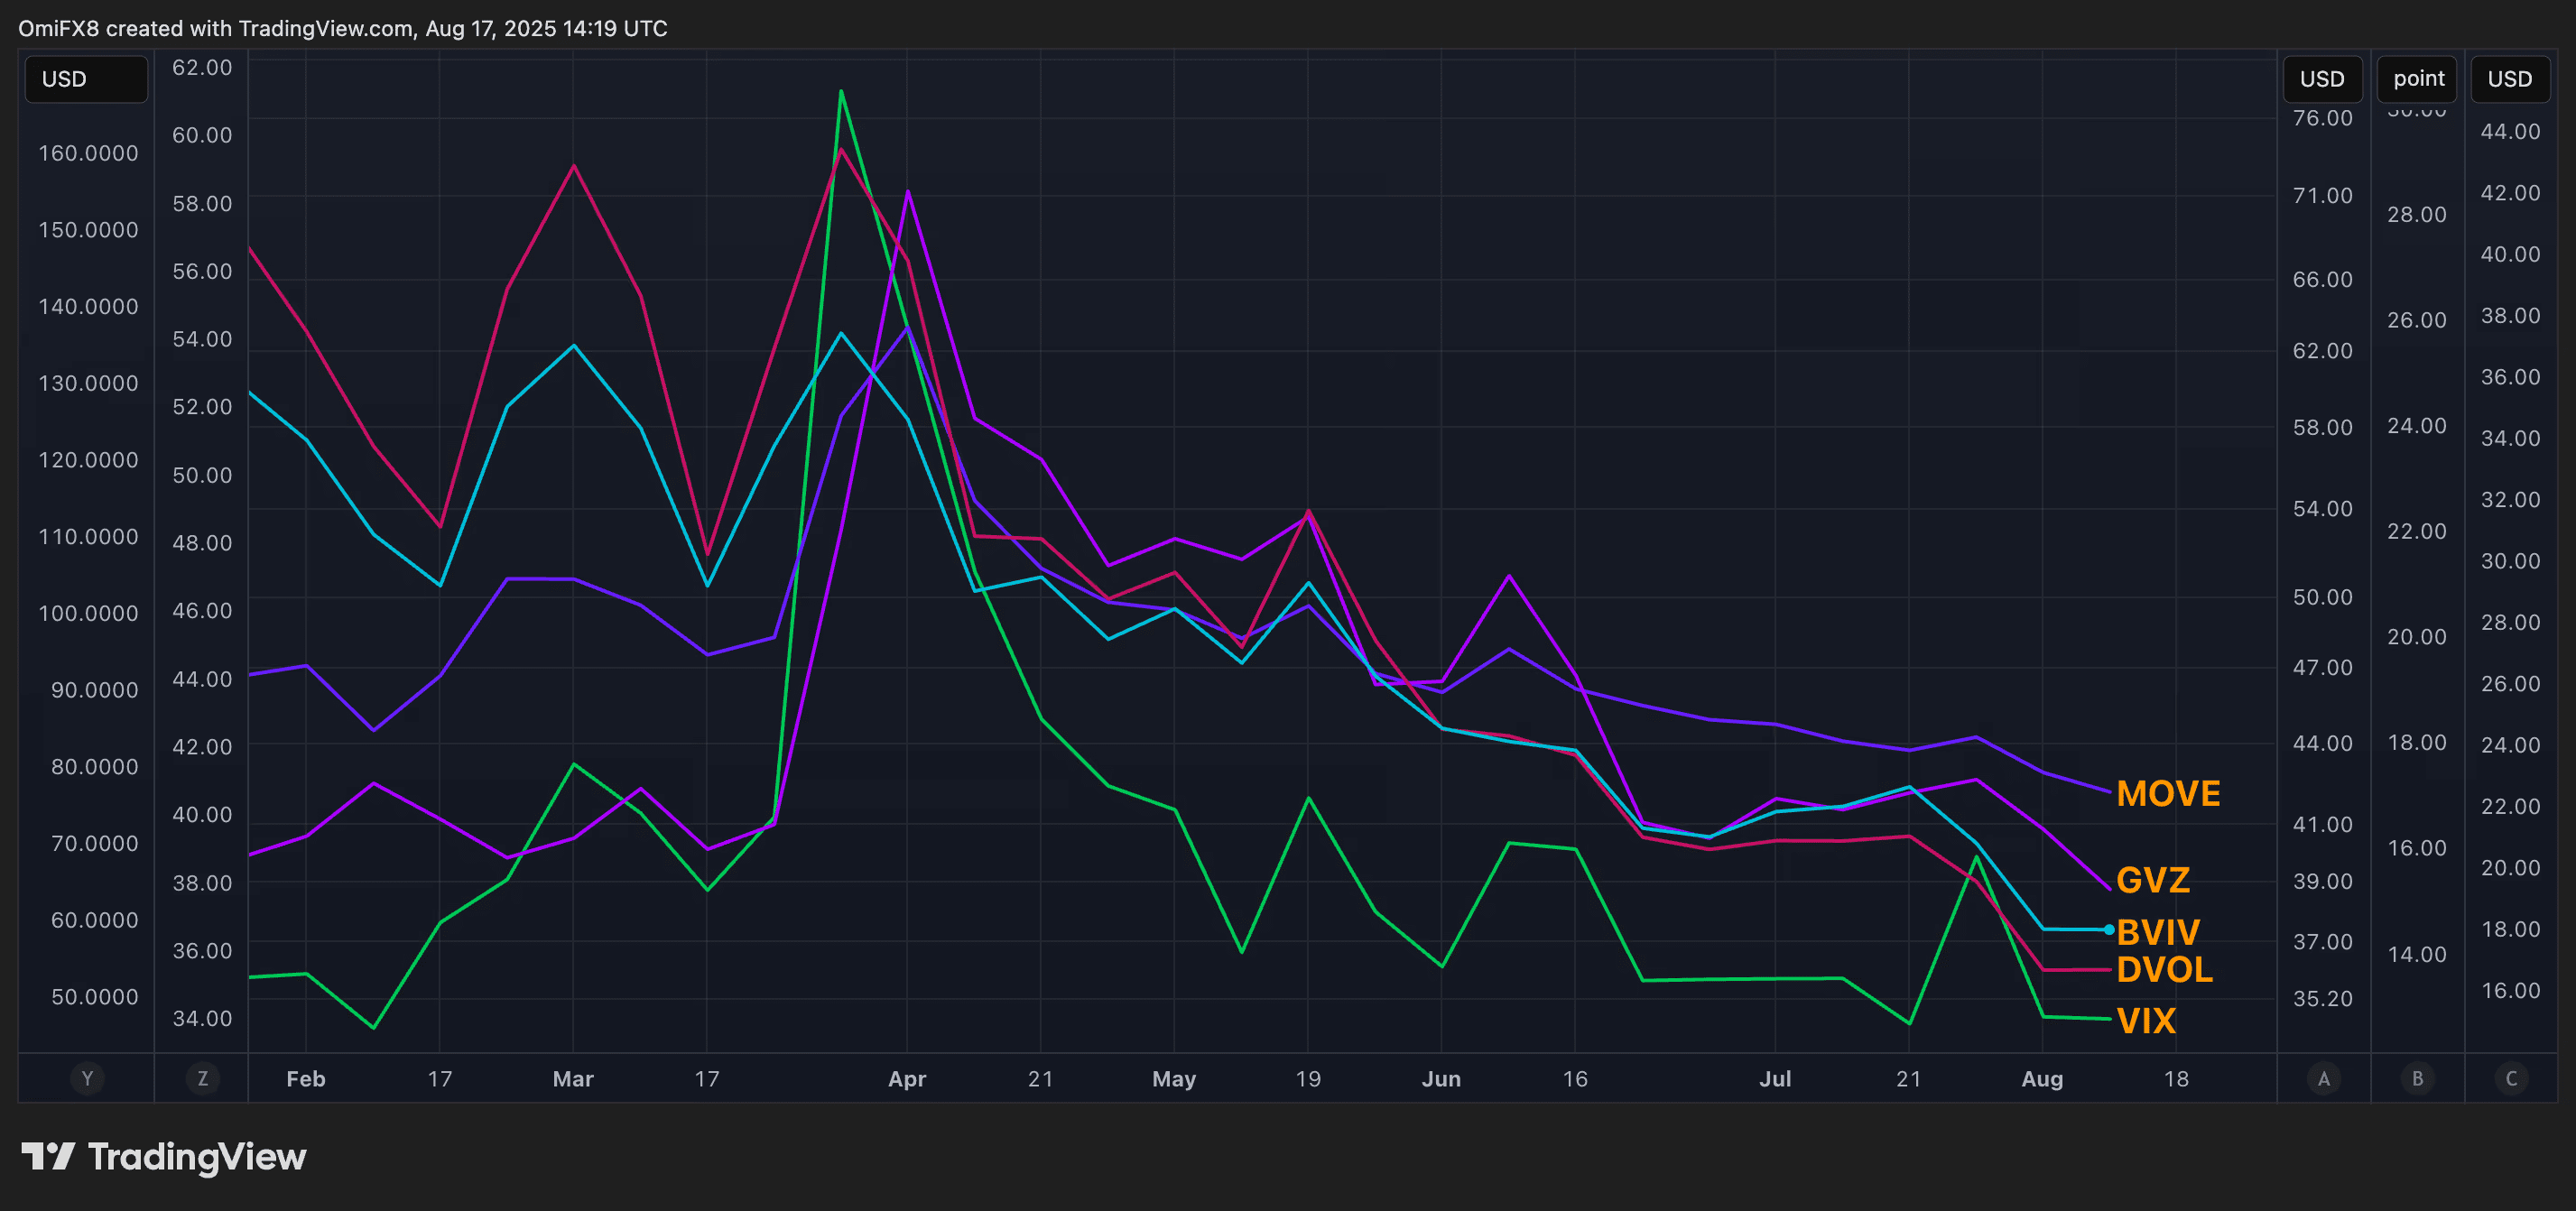
According to TradingView data, Bitcoin (BTC)'s 30-day implied volatility (measured by Volmex's BVIV and Deribit's DVOL indices) has sharply declined in recent months, hovering around 36% last week, close to a two-year low.
Similarly, the CME Gold Volatility Index (GVZ) has more than halved over the past four months, dropping to 15.22%, the lowest level since January of this year. This index measures the expected volatility of the SPDR Gold ETF (GLD) over the next 30 days.
The MOVE Index (which tracks the 30-day implied volatility of U.S. Treasuries) has also continued to decline, hitting a three-and-a-half-year low of 76%. Meanwhile, Wall Street's 'fear index,' the VIX, fell below 14% last week, significantly down from nearly 45% in early April. Major currency pairs (such as EUR/USD) also experienced similar compression in volatility.
This significant decline in the volatility of major assets has occurred against the backdrop of expectations that central banks (especially the Federal Reserve) will start cutting rates from a 'tightening range,' rather than in a crisis scenario.
An anonymous analyst at Endgame Macro pointed out on social platform X: "Most major economies are not cutting rates from super-low or emergency levels like after the financial crisis or during the COVID period, but rather starting to cut rates from restrictive ranges. This means interest rates remain high enough to dampen growth, and in many cases, the real interest rates adjusted for inflation are still positive. This is a significant difference from past easing cycles, which will determine the direction of future market trends."
According to CME's FedWatch tool, the Federal Reserve is expected to cut interest rates by 25 basis points in September, restarting the easing cycle after an 8-month pause. JPMorgan expects the Fed's benchmark rate to fall to 3.25%-3.5% by the end of Q1 2026, a 100 basis point drop from the current 4.25%.
Some observers believe Powell may pave the way for new easing in his upcoming Jackson Hole speech.
Edward Jones Senior Global Investment Strategist Angelo Kourkafas stated: "The path of interest rate cuts may not be smooth; markets have often eagerly anticipated rate cuts over the past two years but have sometimes been disappointed. However, we believe the direction of interest rates is still likely to trend downward."
He added that as inflation stagnates and labor market pressures intensify, the risk balance may soon tilt towards action. "Powell's speech at Jackson Hole may confirm the market's high expectations: rate cuts will resume in September after a seven-month pause."
In other words, the decline in asset volatility largely reflects expectations of monetary policy easing and economic stability.
Is the market too complacent?
However, contrarians argue that this may be a sign of market complacency. President Trump's trade tariffs may weigh on economic growth, and the latest data also shows that inflation remains stubborn.
Look at the price levels of most assets — including Bitcoin and gold — which are almost at historical highs.
Scott Bauer of Prosper Trading Academy said in an interview with Schwab Network last week that volatility is too low after the latest round of economic data releases, while there is still more uncertainty ahead.
This argument of 'market complacency' is more persuasive in the performance of the bond market: corporate bond spreads have dropped to the lowest level since 2007. Goldman analysts remind clients not to be complacent and to maintain hedging positions.
Goldman Sachs strategist Lotfi Karoui wrote in a report on July 31: "Downside risks remain, economic growth may be further disappointing, deflationary pressures may ease, or concerns over the independence of the Federal Reserve may trigger a sharp sell-off in long-term U.S. Treasury yields."
In any case, volatility has mean-reverting characteristics — periods of low volatility often lay the groundwork for more severe market turbulence in the future.
Bitcoin Technical Analysis
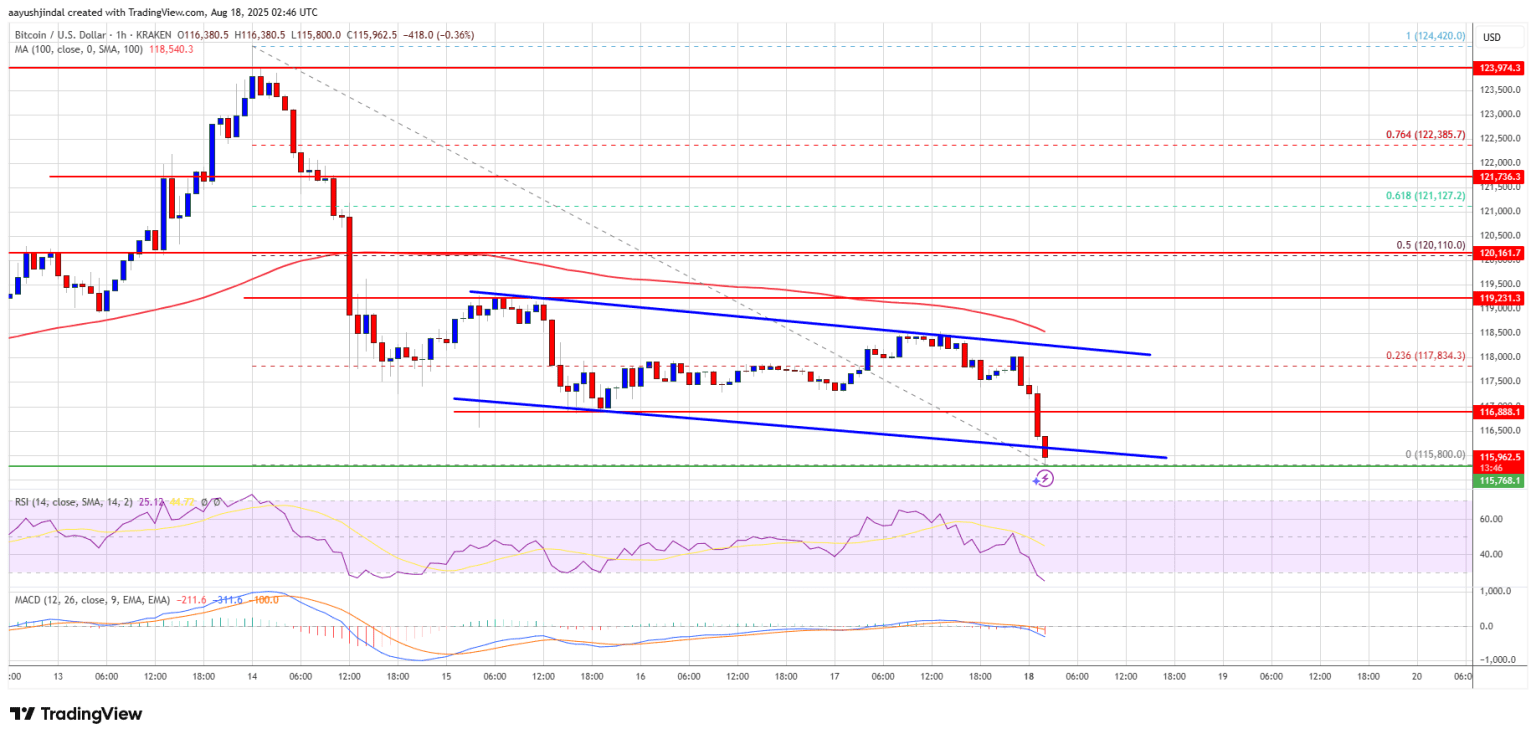
After Bitcoin price reached a historic high near $124,000, it began a new round of declines. BTC showed bearish momentum, breaking below the $120,000 support zone. The price further fell below the $118,500 support level and the 100-hour simple moving average. Additionally, on the BTC/USD hourly chart, the price also fell below the key descending channel support at $116,200. The currency pair subsequently tested the $115,800 area.
Currently, Bitcoin is consolidating below the 23.6% Fibonacci retracement level of the decline from a low of $115,800 to a high of $124,420. BTC is currently reported below $118,000 and below the 100-hour moving average.
On the upside, the recent direct resistance level is around $116,850. The first key resistance level is at $118,000. The next resistance level is at $118,500. If the closing price can break above $118,500, prices may rise further. In this case, BTC could rebound to the $119,200 resistance level. If the upward momentum continues, the target may point to $120,000, or even the 50% Fibonacci retracement level of the drop from $124,420 to $115,800. The main target is at $121,500.
On the downside, if Bitcoin fails to break through the $118,000 resistance area, it could trigger a new round of declines. Direct support is near $115,800. The first major support level is at $115,000. The next support level is in the $113,500 area; if it continues to decline, it may test $112,500. The major support level is at $110,000; if this level is broken, BTC could continue to drop.
Technical Indicators
Hourly MACD: The MACD is accelerating into bearish territory.
Hourly RSI: The RSI of BTC/USD is below the 50 level.
Major support levels: $115,800, $115,000
Major resistance levels: $118,000, $118,500
