
Source: Digital Asset Research, compiled by Shaw Golden Finance.
Frankly, I've seen enough of the four-year cycle theory, and today I'm going to rant about why those who follow this theory will ultimately fail.
These people have never studied time or cycles in their lives yet are certain that the four-year cycle will complete. They have no idea what they are dealing with and will ultimately be forced to buy at higher prices.
This is a data-driven argument, not some random speculation. I am just fed up with the overwhelming pessimism and excessive caution in the market, which makes me extremely optimistic.
I'm not trying to exaggerate how this market will behave, but this sentiment alone is enough for me to assert that I am fed up with this nonsense. We will continue to rise, for longer than these people remain rational.
A bull market does not peak when everyone is ready to take profits and walk away. It peaks when people rush to leverage, mortgage properties to buy more stocks. It peaks when your simple-minded friends/neighbors/cousins or uncles make a killing far beyond their means and then quit their jobs to become investment professionals. It peaks when no one, I mean no one, is bearish anymore.
Today's situation is quite different; whenever the S&P 500 drops 3%, investors flee the market; or the entire cryptocurrency world plans to sell in the next three months based on some cycles they fabricated out of thin air, with no strong data to support it.
What these new cycle experts do not realize is that the quality of a cycle depends on the underlying conditions that form it.
"The map is not the territory" comes to mind at this moment.
This means that while you can keep staring at the map, it will only give you a rough idea of where you are. The map won't tell you that there's a big pit 300 feet to your left. It won't tell you that there's a massive oak tree in the middle of the field. It won't tell you that there's an abandoned shed a mile ahead. Of course, it won't tell you that it's 110 degrees Fahrenheit outside with 50% humidity. Or whether you are in a jungle or a deciduous forest.
The map will show you the coordinates and direction of your location, but it cannot let you perceive the actual objects, environment, and terrain, which are what you might encounter while navigating.
The cycle is a map that provides us with a timeframe and historical data, giving us a rough idea of what we typically see, but the underlying conditions behind the market are the real reality.
These conditions determine the size, volatility, and various fluctuations of the cycles.
The cycle we are currently in is fundamentally different in conditions from the last three cycles. Next, we will analyze why and how this is reflected in the charts. There is a key distinction between 'this time is different' and 'it's the same old story but with differences.'
Price structure and behavior.
From the very beginning of this cycle, we can clearly see that the market's structure and behavior differ from previous cycles. The reason is that new assets and markets will go through different growth and adoption phases. This reminds me of Peter Lynch's view that company styles change over time.
Companies are not always high-growth companies. Over time, they transition into slower-growing companies but become stalwarts in their industry.
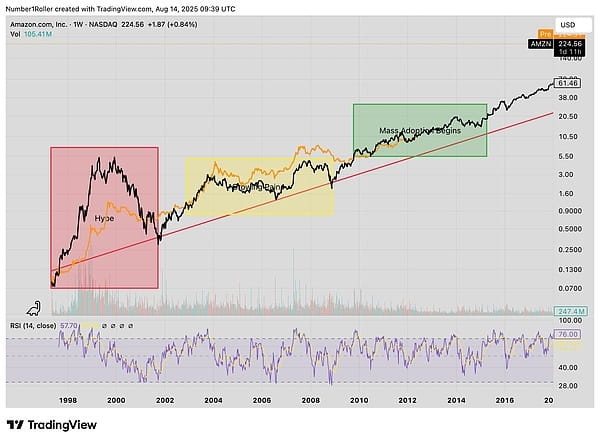
This is a typical adoption cycle, where the first phase is a hype cycle, the second phase involves growing pains and uncertainty, and the final phase is when mass adoption begins, and the majority of early users start to dominate.
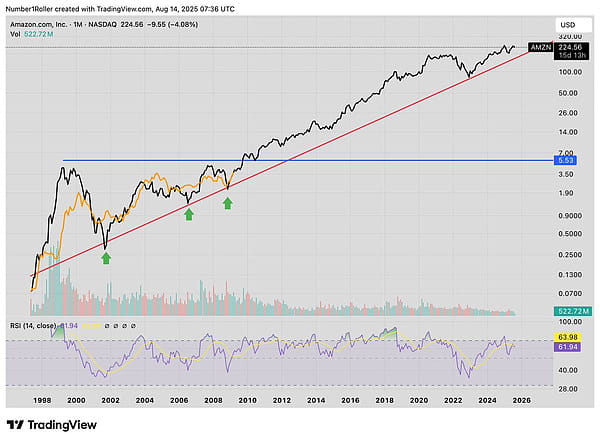
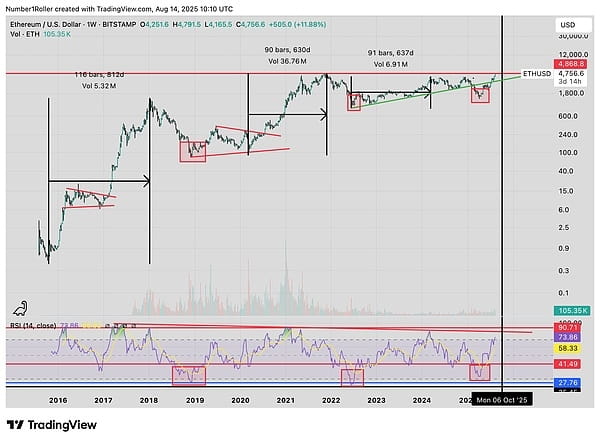
Let's take a look at Amazon's case, including its lifecycle and market structure, and compare it with Bitcoin and Ethereum.
Similarly, ETH is shown as follows.
This is the argument we made during the market crash in the first quarter a few months ago.
We have shown the close relationship between Amazon (AMZN)'s current structure and behavior and what we are currently witnessing in major cryptocurrencies.
Clearly, the cycle in early 2017 was driven by a lot of speculation, similar to Amazon in 1999. Then the bull market in 2021 was structurally more like a sideways consolidation rather than a massive expansion. This is the key test of whether the asset can survive the crash in 2020 and the bear market in 2022 to prove its worth.
Similarly, Amazon (AMZN) did not set a new all-time high until after 2008. It went through a long struggle to prove that it could survive after the internet bubble burst and indeed create a long-term viable business.
Finally, we have entered the stage of mass adoption, where most of the early groups are starting to join in. This is the last barrier for Bitcoin and cryptocurrencies as an asset. The last argument once made—'What if the government bans it?'—is no longer valid. The government has not only not banned it but is actively trying to embrace it. This is the typical development process of an adoption curve.
Okay, that's great; we know we are in the mass adoption phase, but what does that have to do with the four-year cycle?
Dow Jones.
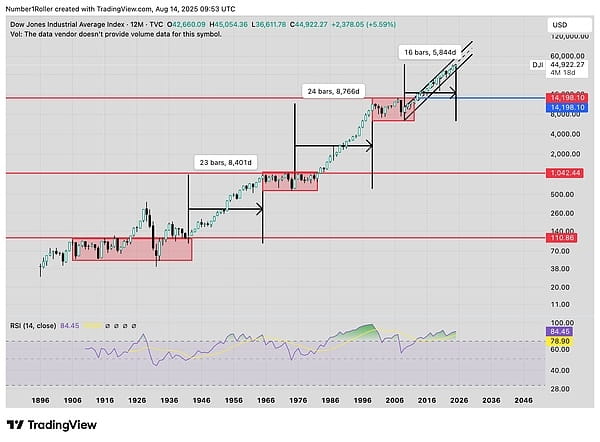
Let's take a step back and look at the Dow Jones index. The Dow Jones index is undoubtedly a favorite chart of any serious analyst, as its price history on Trading View dates back to 1896. With over 100 years of data, this is the highest quality dataset we can rely on.
Looking back at the one-year chart of the Dow Jones index, we can see that there have been three prolonged consolidations lasting over ten years in its history. After the first two consolidations, the expansion period lasted approximately 17 to 23 years. The most recent consolidation occurred from 2000 to 2013. Currently, this rise has only lasted 16 years; if this is the peak, it would be the shortest in history.
If we take a close look at this 16-year bull market that started from the low in 2008, we can see that it retested previous highs four times.
The bottom in 2015 was a retest of the top in 2008. The bottom in 2020 was a retest of the top in 2015. The bottom in 2022 was a retest of the top in 2020. And the recent bottom in April was a retest of the top in 2022.
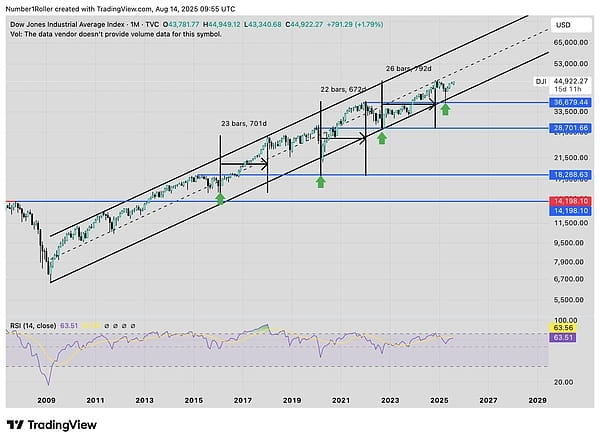
The market operates with clock-like precision, continually turning previous peaks into support levels while moving up along this bull market channel. However, the key lies in the duration of the market's rise after each pullback. From the chart above, we can see that the shortest upward cycle lasted 22 months. Currently, from the low in April, we have only risen for 5 months. If we calculate based on the shortest 22-month upward cycle, then the market will peak in early 2027.
This is another great data point that shows you why I think the entire market looks promising at least for the next 12 months. In this environment, I find it hard to believe that cryptocurrencies will crash while stocks continue to rise.
From bull to bear to bull.
Another reason I am convinced that this bull market has just begun is the crash in April.
I don't think people fully recognize the level of panic that the crash brought to the stock and cryptocurrency markets. We are talking about market sentiment, time, and prices, all at severely bearish levels.
The readings we are seeing are comparable to the oversold levels and panic levels of 2020, 2008, and 2000. The market has completely collapsed.
This actually provides the momentum needed for the market to initiate a new bull run, the duration and strength of which will exceed everyone's expectations.
Look at Ethereum (ETH). Ethereum's drop lasted longer than the FTX crash, and the price decline was almost the same. In my view, this marks the end of the bear market that began at the market peak in 2024. We formed a triple top in the last surge in November, followed by a bear market lasting over 50 weeks that ended with that crash.
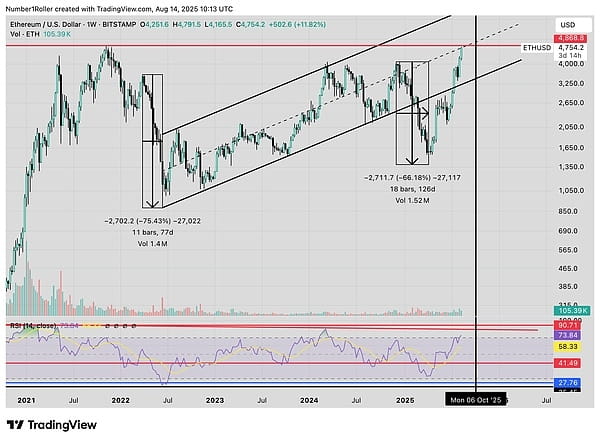
The reason supporting this view is that Ethereum (ETH) has actually gone through a complete bull market. A typical bull market lasts between 90 to 120 weeks. Subscribers know the importance of these time factors.
Interestingly, the period from the low in 2022 to the high in early 2024 is exactly 90 weeks. In other words, I believe that was a quietly completed full cycle, followed by a bear market cycle that began from that high and lasted a full year (similar to other bear markets), ending with the crash in April.
Just look at the relative strength index (RSI) readings in the chart above. The weekly RSI has only reached these levels three times, and all three were bear market bottoms. The low in April corresponds to a bear market bottom, providing us with ample room for an upward move.
Copper/Gold Ratio.
This is a great market correlation chart provided to me by Bravos Research.
This is the copper/gold ratio chart, which has been predicting Bitcoin's parabolic movements and cycle tops since 2013.
Every time this chart bounces off the bottom, Bitcoin begins its most rapid expansion. Subsequently, when it peaks, Bitcoin also stays at a high level.
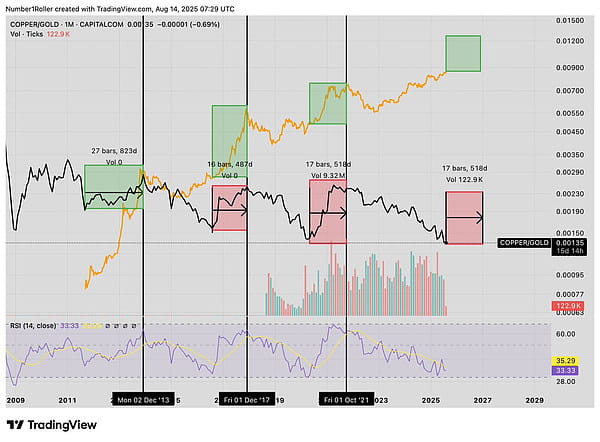
I find this chart very interesting for two reasons. In addition to correlation (the most obvious I've seen), the time aspect is also fascinating. This chart is currently at a low point; assuming it is bottoming out, a typical bull market cycle lasts 17 months.
From today, in 17 months, that is, by early 2027, this aligns with what I just showed you regarding the Dow Jones index.
Not only will it continue to rise for 17 months, but it also coincides with the maximum phase of the Bitcoin bull market, which is said to have not even started yet.
By the way, I want to show you some data from Stansberry Research that highlights the short positions on Bitcoin in trader commitments.
Currently, our bearish level has reached the highest since 2021.
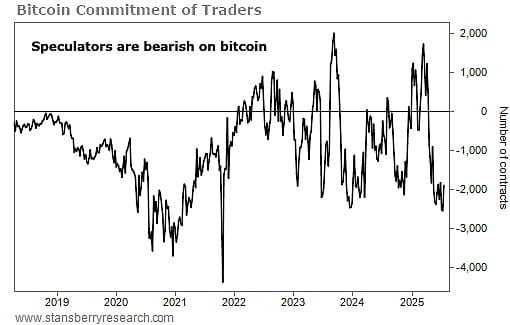
Stansberry's data continues to indicate that whenever the COT reaches a new extreme one-year bearish level, the subsequent price action will look like the following.
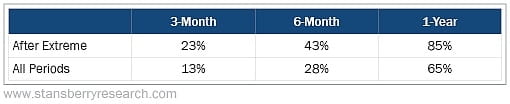
This is only 6 years of data, but based on this, it is inferred that Bitcoin could soar to $230,000 by this time next year, which again indicates that the cycle will be longer based on these extreme readings.
Altcoins.
Next up is altcoins. I don't have much to say about altcoins, except that I think the prospects for a major altcoin market rally are very bright. However, significant market fluctuations take time, and as you can see, if these fluctuations take time to complete, then the four-year cycle is meaningless.
Look at the 'Other' charts below; if you think there are any bearish signals, then you cannot call yourself an analyst. Just based on this structure, you can have extremely optimistic expectations for altcoins.
Furthermore, we know that the longer it takes for the market to break through previous highs, the greater the amplitude of its fluctuations.
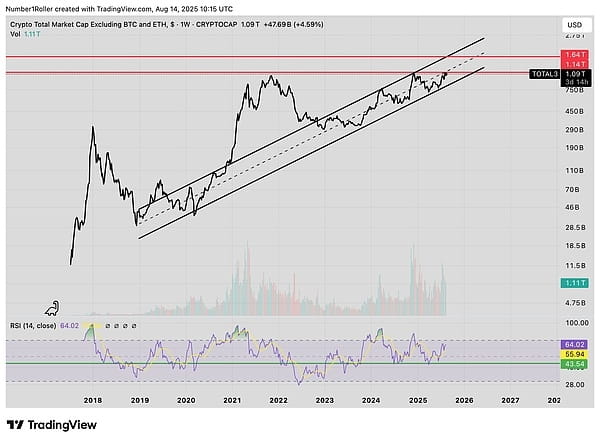
Once this situation erupts, it's hard to say how far it will develop, but I highly doubt it will end after just 8 weeks following nearly 5 years of brewing.
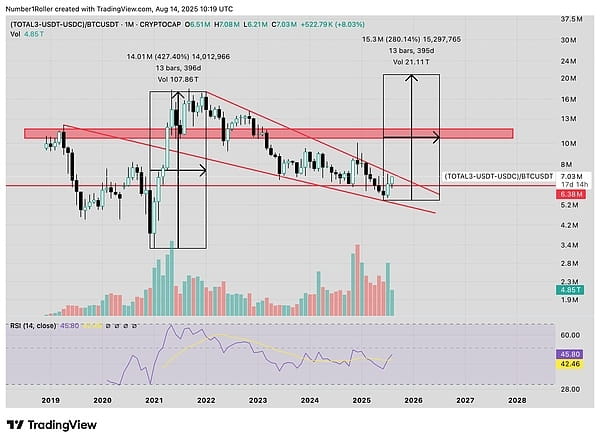
From the comparison of TOTAL3 and BTC below, we can roughly understand some of the time required. Not only is it just starting and has not yet broken out, but the typical run cycle is 12 to 13 months, meaning we won't see results until the second half of next year.
Then a quick look at the overall 'Other' charts shows the same situation but over a longer time span. The difference with the recent bear market is that it has lasted longer than ever before. So when it breaks out, we should expect a significant rise, and more importantly, it will last a long time.
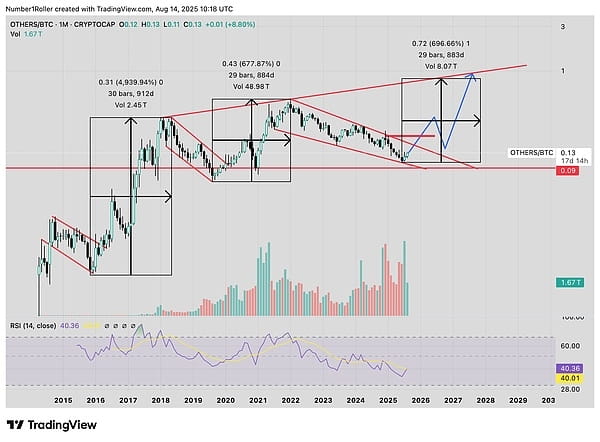
You cannot seriously analyze any of the charts above and conclude that the breakout will end in eight weeks. From these charts, we expect the uptrend to last 12 to 18 months.
Halving Theory.
Lastly, let's talk about the halving theory; as I understand it, this is precisely the fundamental reason for the four-year cycle narrative, right?
If the halving theory is correct, then why did we set a new ATH before the 2024 halving? According to that theory, we should have only set a new ATH after the halving.
And why did we crash in the first quarter of the fourth year of the four-year cycle? This has never happened before. But it's still the same old story, isn't it?
In my view, it seems that many cracks have appeared, but these people, like bears in a bull market, refuse to give up and are unwilling to accept reality.
Here is an innovative idea proposed by the famous BTC OG Adam Back, who is even cited in the Bitcoin white paper.
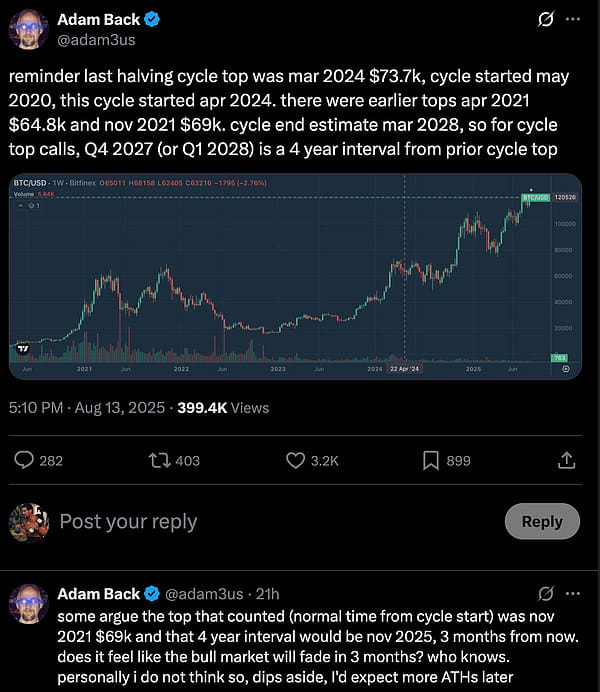
He pointed out that the cycle top is actually in April 2024, as technically that is the peak of the halving cycle, and the next halving cycle will end in mid-2028.
An interesting point, and reasonable in my opinion. This does not mean that Bitcoin won't see a pullback before 2028, or that 2028 is the cycle top target I believe it to be; it simply indicates that the halving has no actual impact on Bitcoin's price.
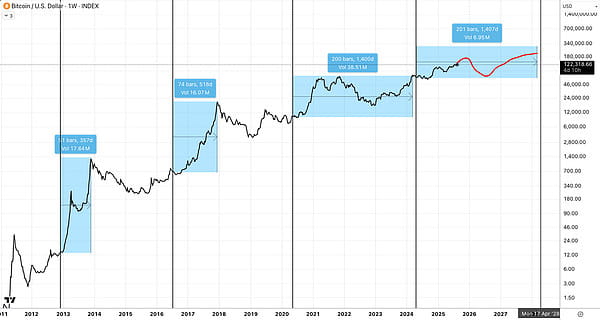
Below is a view of Bitcoin's halving and cycle top.
To summarize.
This statement is a bit exaggerated, but I strongly believe there is a lot of data indicating that this four-year cryptocurrency cycle will not end. In my view, the current contrarian perspective is clear: both stocks and cryptocurrencies will rise significantly and last longer.
Even though everyone is worried about the four-year cycle and overvaluation, I suggest taking a good look at the actual data and facts to support these concerns.
Any seasoned market participant can tell you that the current market sentiment is simply not enough to support a market peak.
With Ethereum yet to set a new high and altcoins on the verge of breaking out of a four-year consolidation range, too many are ready to sell at any moment. However, from the perspective of the Dow Jones index and the copper-gold ratio, the market tells us that the potential for upward movement is far greater than many imagine.
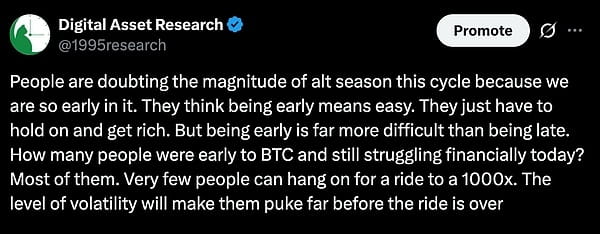
As I mentioned a few days ago on X, longer cycles are harder, not easier. And because people believe we are still in the early stages, they think the cycle won't last too long because then they would make a killing. That is not the case. The longer the cycle, the greater the chance of loss for people.
Not many people consider the fact that from the low on June 22 to the high on April 24, Ethereum did indeed experience a complete bull market, followed by a full year of bear market. From the perspective of time, price, and market sentiment, all of this indicates that this view is accurate, but most people overlook it.
Worry, fear, and doubt will continue to drive this bull market's duration far beyond anyone's expectations. Most people are trapped by the fact of the four-year cycle, which only adds more fuel to this fire.
Keep in mind that the market will go to great lengths to deceive as many people as possible.
Even though we are entering a long bull market, it doesn't mean the process will be smooth. There will be drops, pullbacks, and corrections that can even confuse the most experienced veterans. Having a framework that understands market conditions is crucial to help you find the right position that many investors are striving to discover.