The diagonal triangle (wedge) is a driving pattern, but not a motive wave. In wave structures, the diagonal triangle replaces the motive wave in specific positions; similar to the motive wave, no sub-wave within the diagonal triangle fully retraces the previous sub-wave, and the third sub-wave is never the shortest wave. However, the diagonal triangle is the only five-wave structure in the direction of the main trend, where wave 4 always enters (overlaps) the price territory of wave 1. In rare cases, the diagonal triangle ends in exhaustion.
The diagonal triangle is divided into two main categories: ending diagonal triangle and guiding diagonal triangle. In this issue, we explain the ending diagonal triangle.
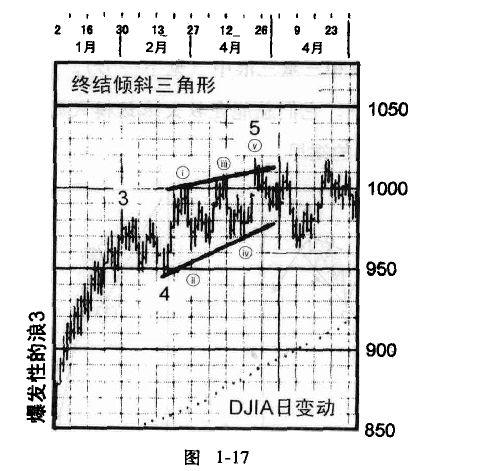
The ending diagonal triangle is a special type of wave that mainly occurs in the fifth wave position, and a small percentage appears in the C wave position of an A-B-C structure. It appears as the final C wave in double three waves and triple three waves. As the name suggests, 'ending' signifies the exhaustion of large wave movements.
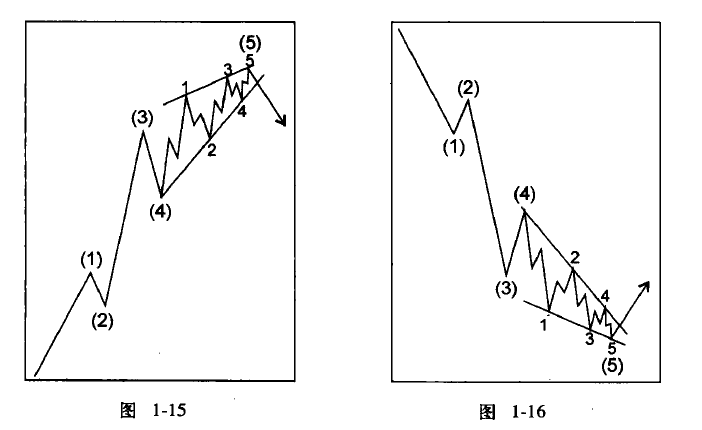
The ending diagonal triangle presents a wedge within two converging lines; the upper resistance line in the upward trend is gentle. Although the price is rising, the strength and slope are no longer comparable to the main upward wave, while the lower support line is steep, indicating a significant correction. This all suggests signs of exhaustion in the upward momentum, and bulls need to be cautious. The descending trend line follows the same principle. Each sub-wave of the ending diagonal triangle consists of three waves, producing a wave count of 3-3-3-3-3 from start to finish.
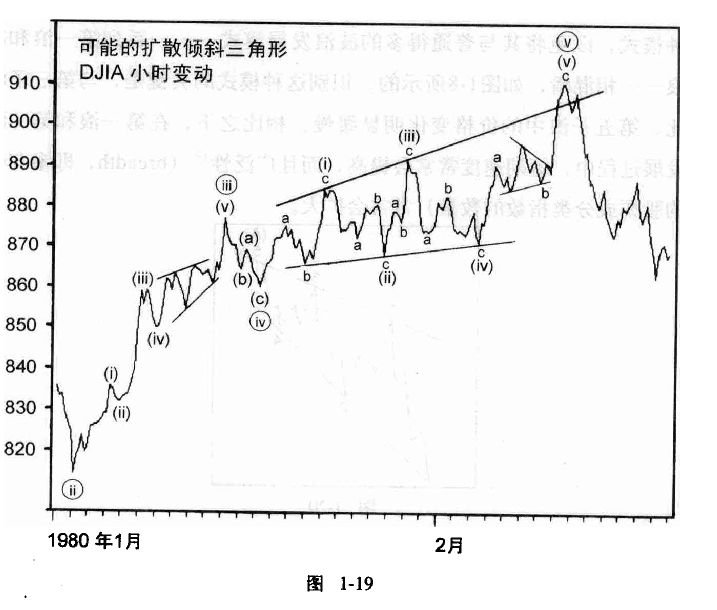
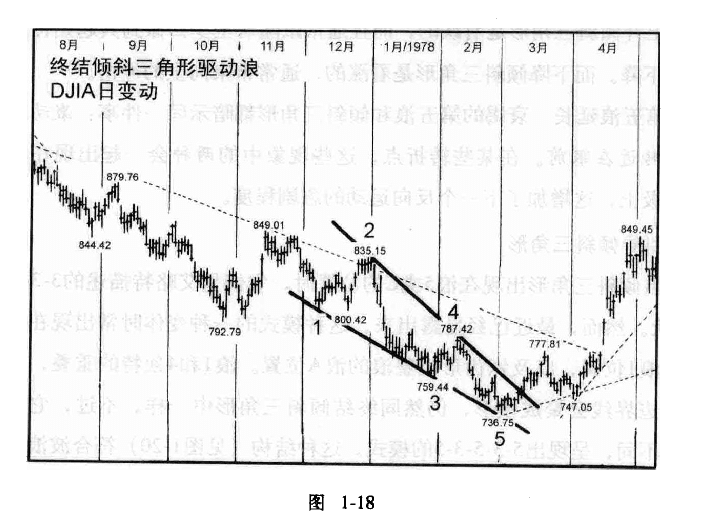
There is another variant pattern of the ending diagonal triangle, where the boundaries are divergent, creating a spreading wedge. This is somewhat awkward in analysis, and for some reason, we do not classify it as an effective variant; the following image is an example for reference.
The fifth wave of the ending diagonal triangle often ends in a 'breakover', which is a brief breakout of the end trend connecting wave 1 and wave 3. Although in smaller wave progressions, the trading volume often gradually decreases, when the breakover occurs, this pattern always concludes with a relatively large volume price spike. In rare cases, the fifth sub-wave may not reach its resistance trend line.
Within the ending diagonal triangle, the ascending wedge is bearish, while the descending wedge is bullish. (Note the distinction from the guiding diagonal triangle in the next period). The extension and exhaustion of the fifth wave, along with the diagonal triangle, simultaneously suggest one thing: an exciting reversal is imminent.
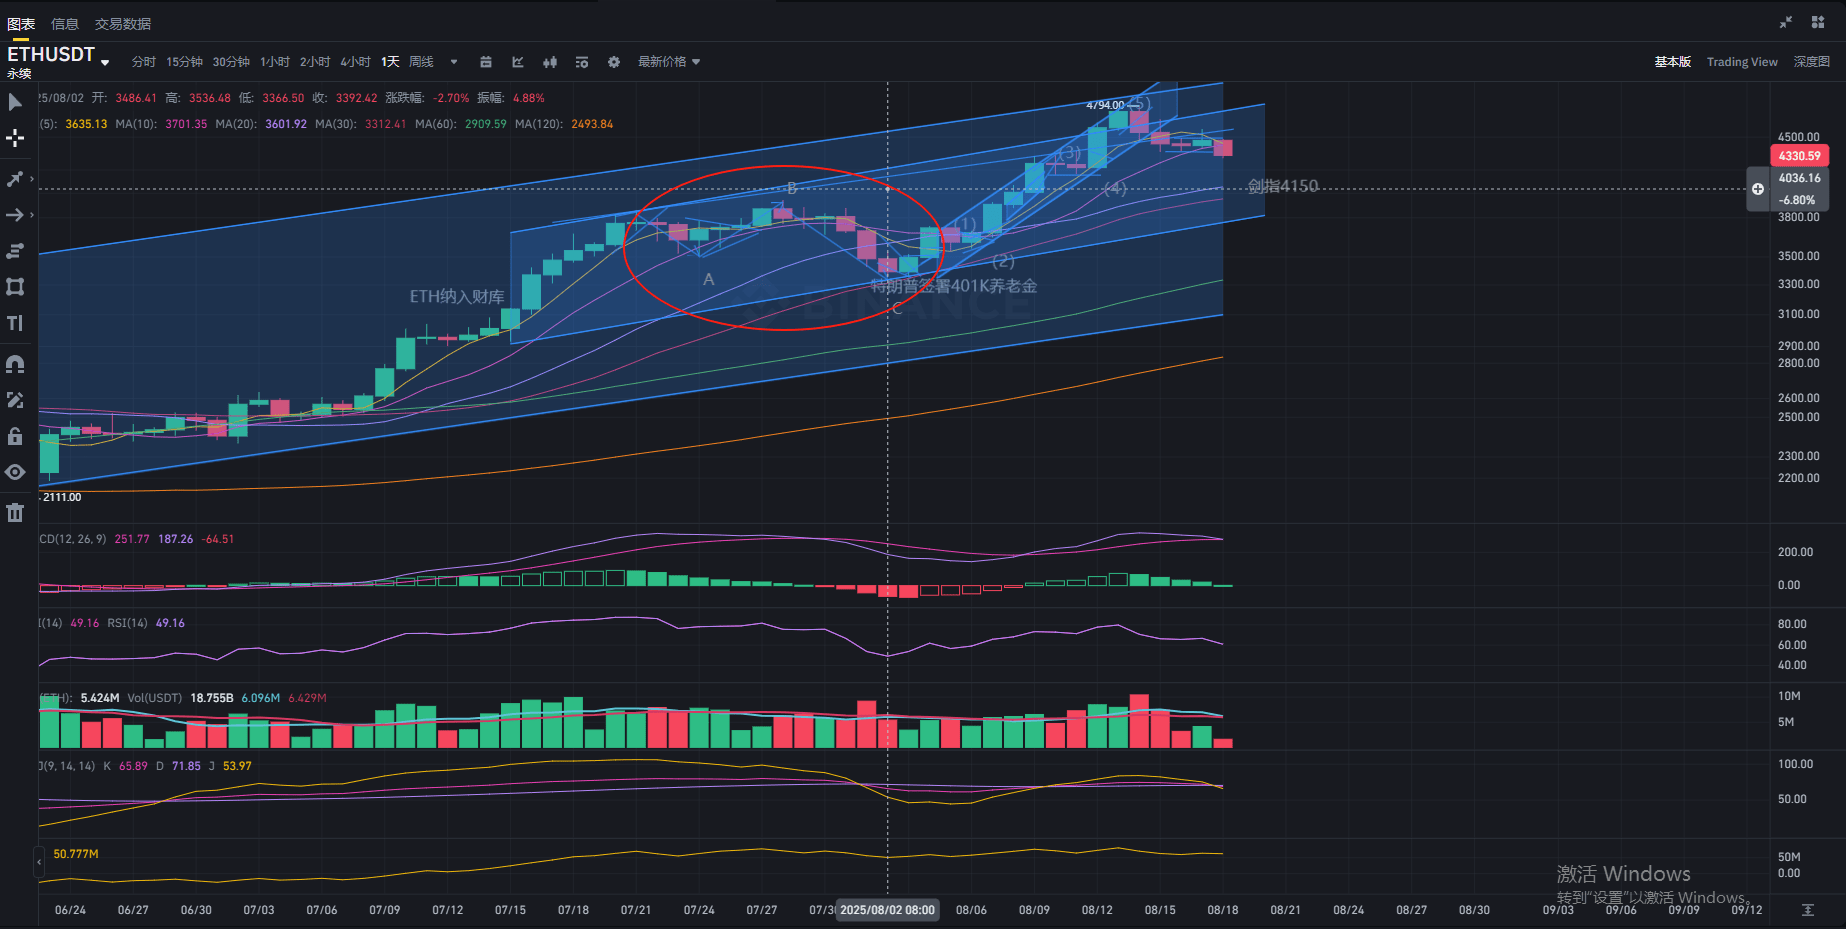
ETH Practical Case:
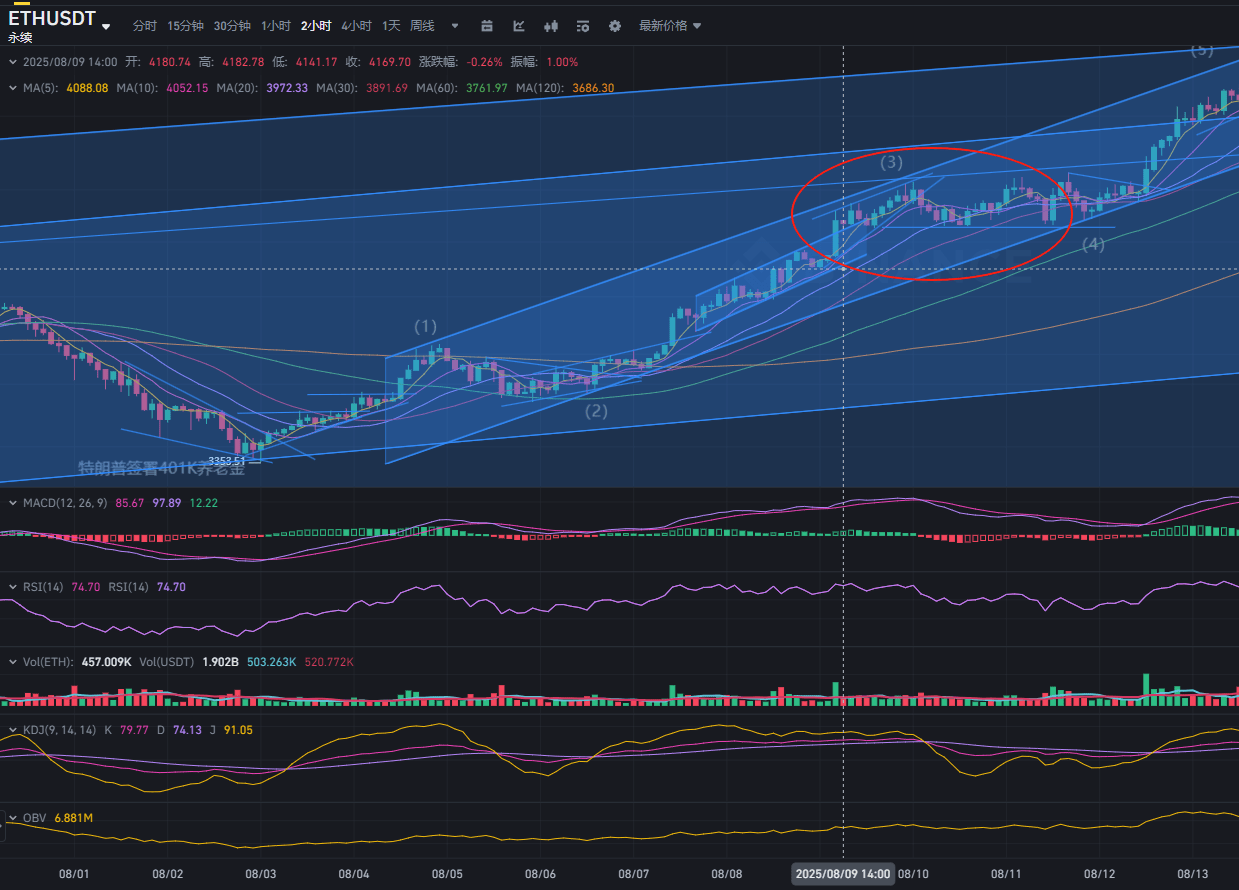
Intermediate Wave (2) - (3) Wave 2H The fifth wave appears to end with a diagonal triangle, suggesting that this wave's upward movement is basically nearing its end, followed by a wave of 4331-4161 correction (magnitude 3.9%)