25/08/17: BTC is either declining or consolidating, ETH is about to rebound for a second test, and the probability of an interest rate cut in September is relatively high.
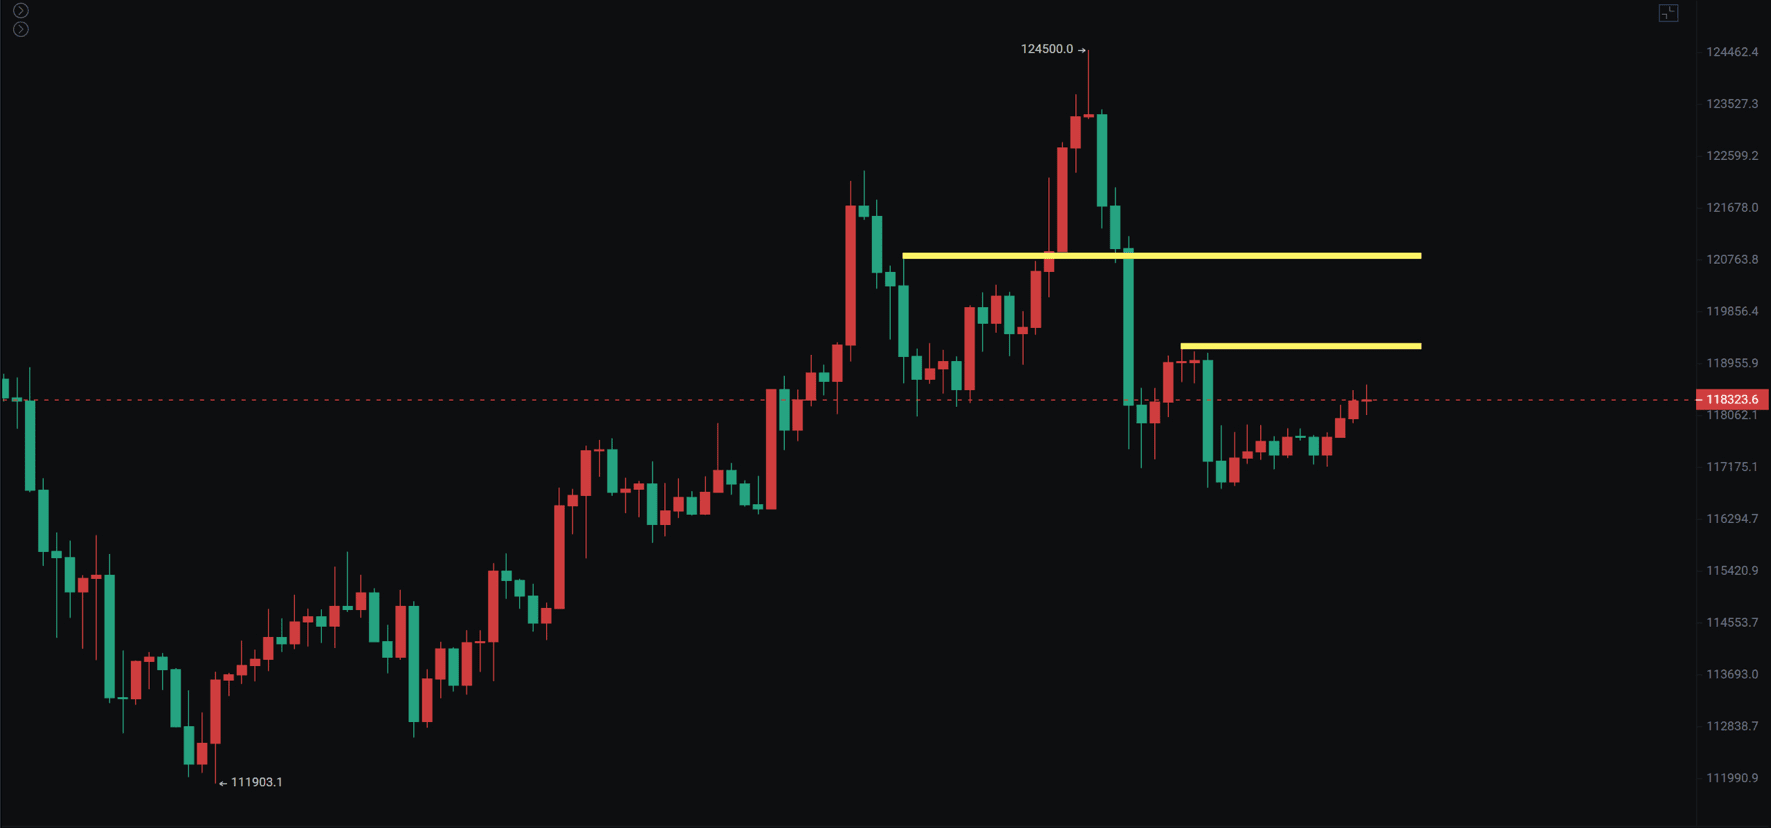
After Bitcoin reached a historical high and then retreated, two voices have emerged in the market: one predicting an imminent crash and the other suggesting further upward movement. Many friends have asked how to view the upcoming market situation. From my perspective, if 116000 holds, there is still a possibility of upward fluctuations, which could indicate a shakeout. However, if 116000 breaks and does not recover, the adjustment period will be prolonged.
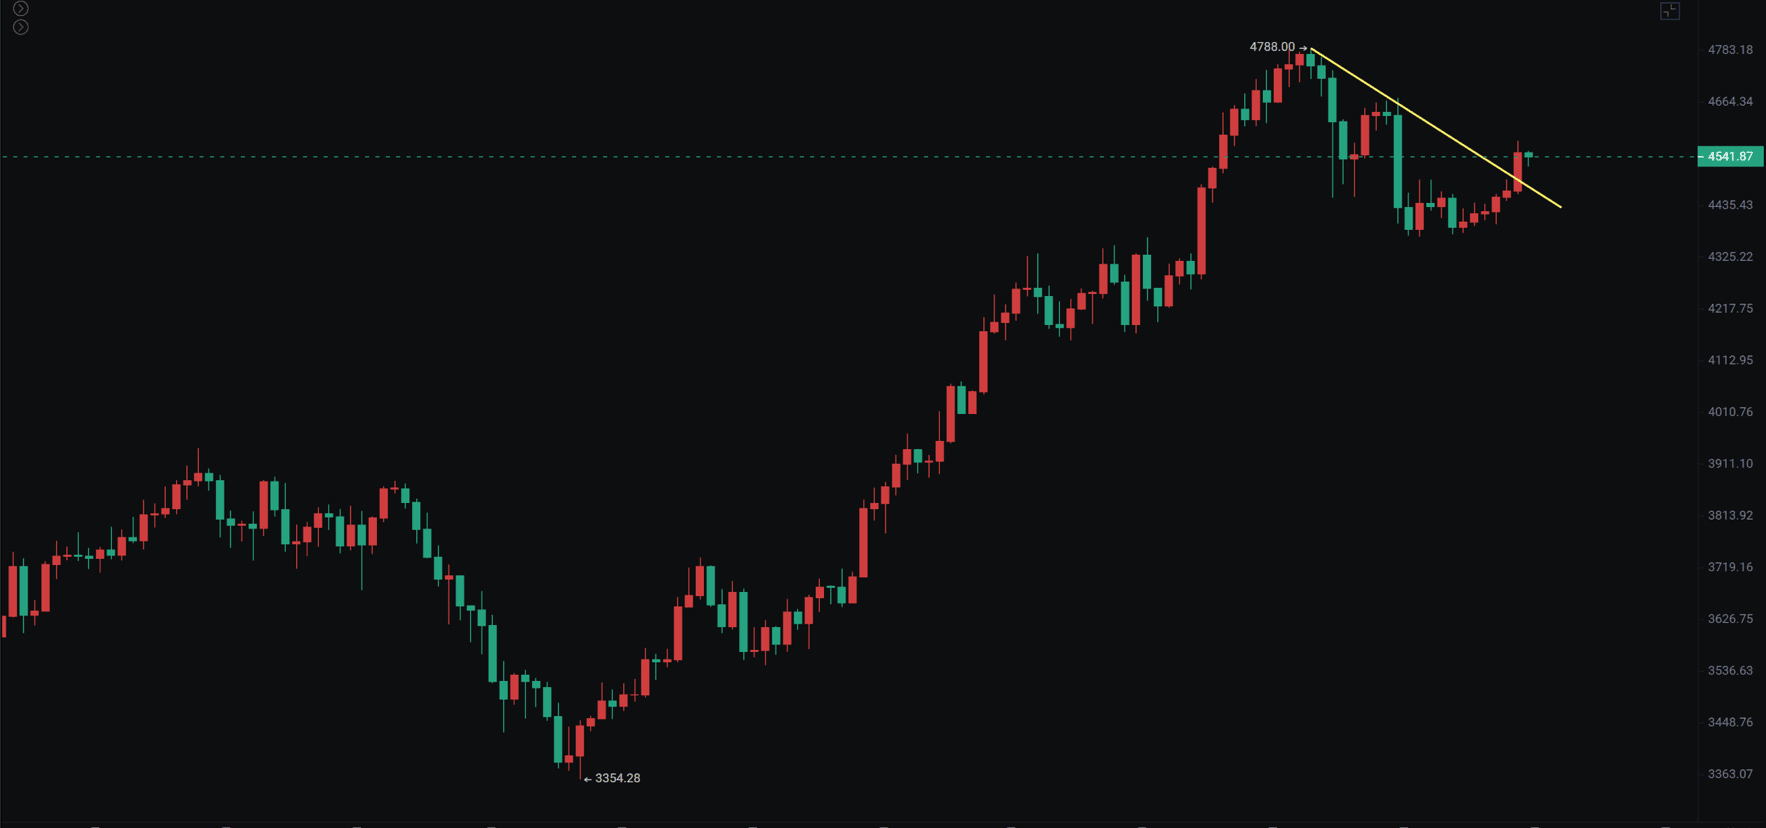
Ether is pulling back near its historical highs, which is very normal. I previously reminded that a pullback would occur between 4500 and 4800. Today, it continues to rebound upward, so we need to pay attention to whether Ether will experience a second peak test. If it cannot break through, the probability of a pullback will increase, but if it breaks the high, we need to focus on whether Bitcoin can lead this trend without falling back.
Bitcoin
The overall structure of Bitcoin is analyzed very clearly in my video; those interested can check it out. From a long-term monthly perspective, Bitcoin is actually performing very healthily. Of course, there are indeed some short-term indicators signaling a need for a pullback, but we still prioritize observing structural trends. The monthly MACD histogram is above the zero line with the fast and slow lines trending upwards. The weekly and daily MACD shows divergence; we first need to see if it can stand above 121000. If it cannot, the probability of a pullback increases.
The daily line is still above the 20-day moving average, which provides support, so the first support level is the 20-day moving average, the second is 116000. Only a drop below 112000 poses a risk of a systemic crash; for now, we need to observe further.
Support: 112000 to 116000
Resistance: 121000 to 125000
Ether
Ether is currently fluctuating around 4500 after a pullback from the previous bull market high. We need to see if this rebound can break new highs; if it cannot, we should reduce our positions. Both the weekly and monthly charts for Ether are bullish, so even on the daily and smaller time frames, there is still a demand for a rebound. The ETH/BTC exchange rate has surged 1.23 times this wave; as mentioned before, if the rebound is strong, there is a chance to touch the weekly MA120, which is also close to the M-top resistance.
If Bitcoin does not experience a systemic decline, Ether's drop will not be significant, with support at 4160 to 4330. Only a drop back to 4100 will pose systemic risk.
Support: 4160 to 4330
Resistance: 4788 to 4868
Many altcoins have basically recovered from their declines, such as LINK, BNB, ADA...


