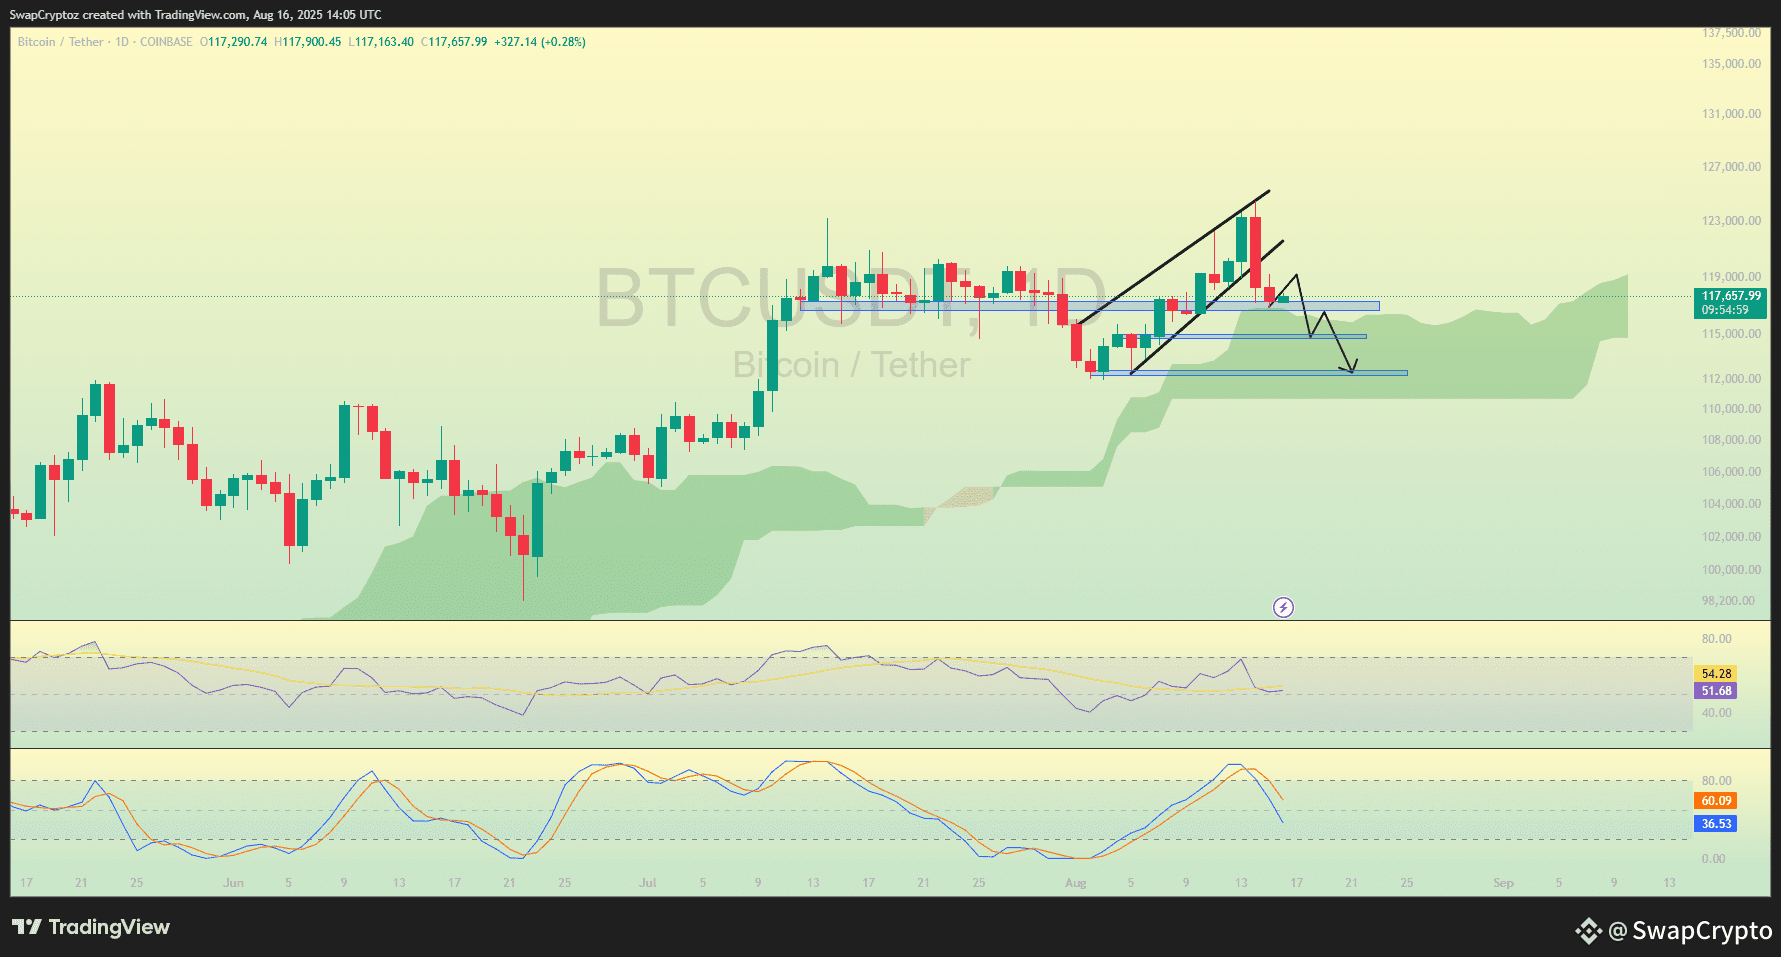
Coin Name : $BTC
This BTC chart shows a rising wedge breakdown. Price is struggling to hold support and could drop toward the $112K–115K range before finding strong buying interest again.
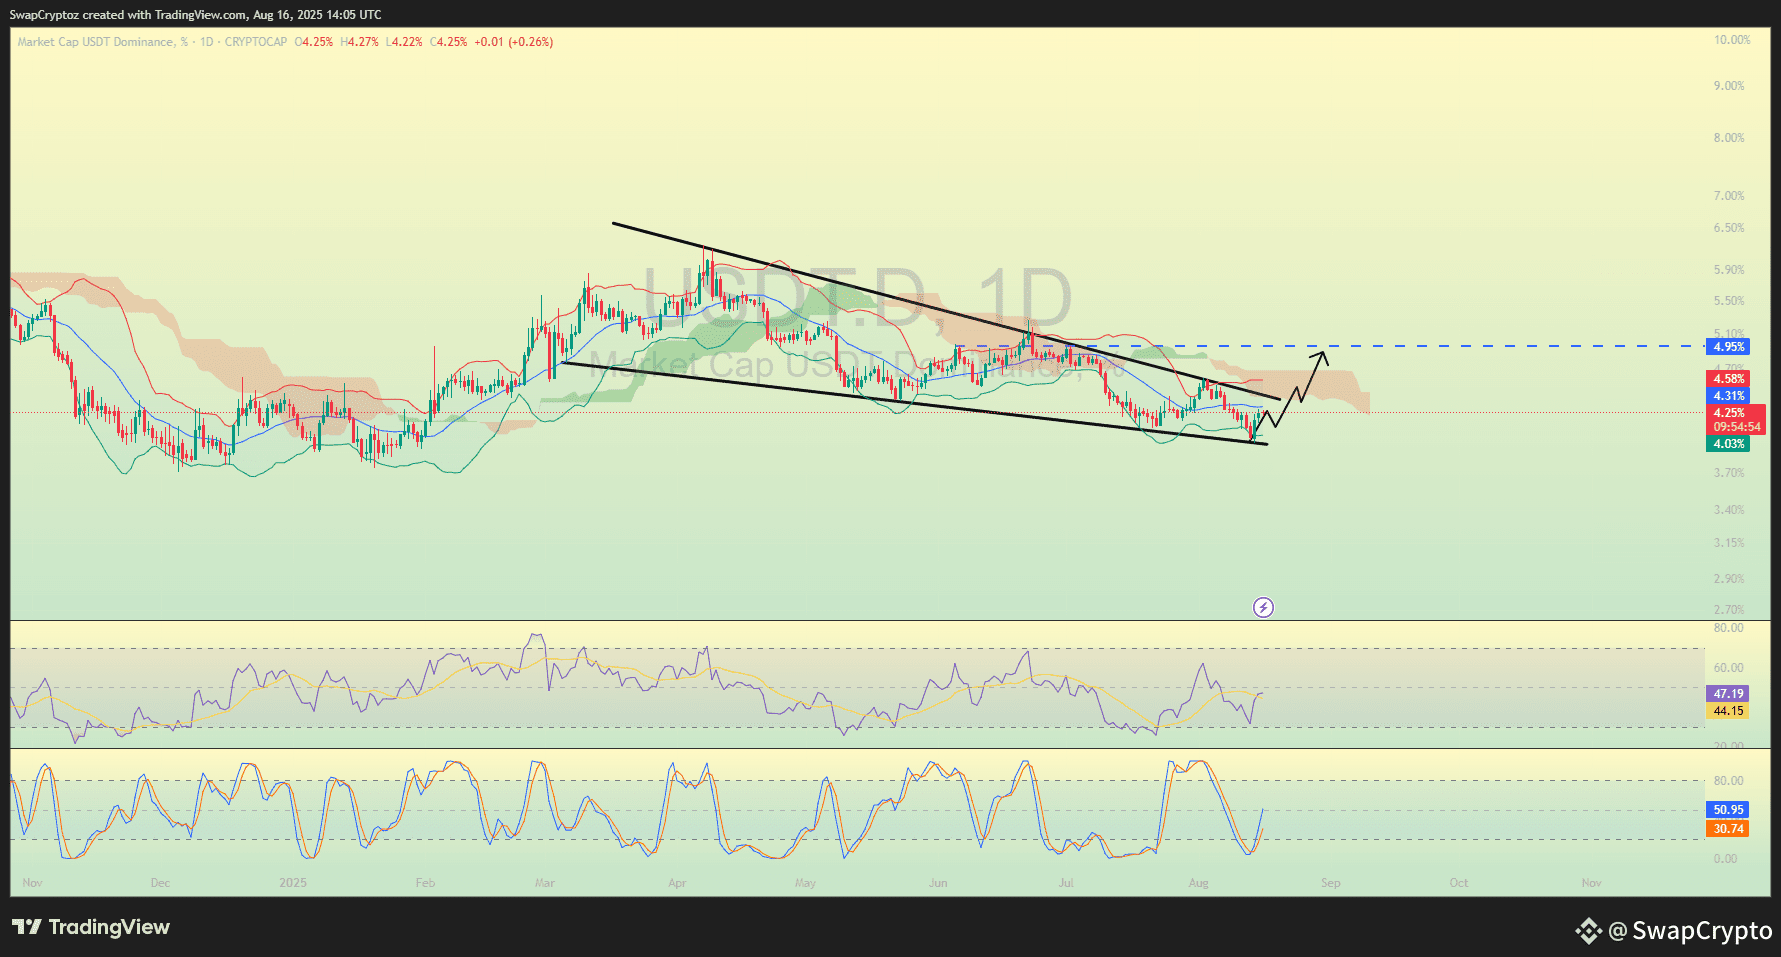
This chart shows USDT dominance trying to bounce from a falling wedge. If it rises toward 5%, it means money moves into stable coins — usually bearish for BTC.
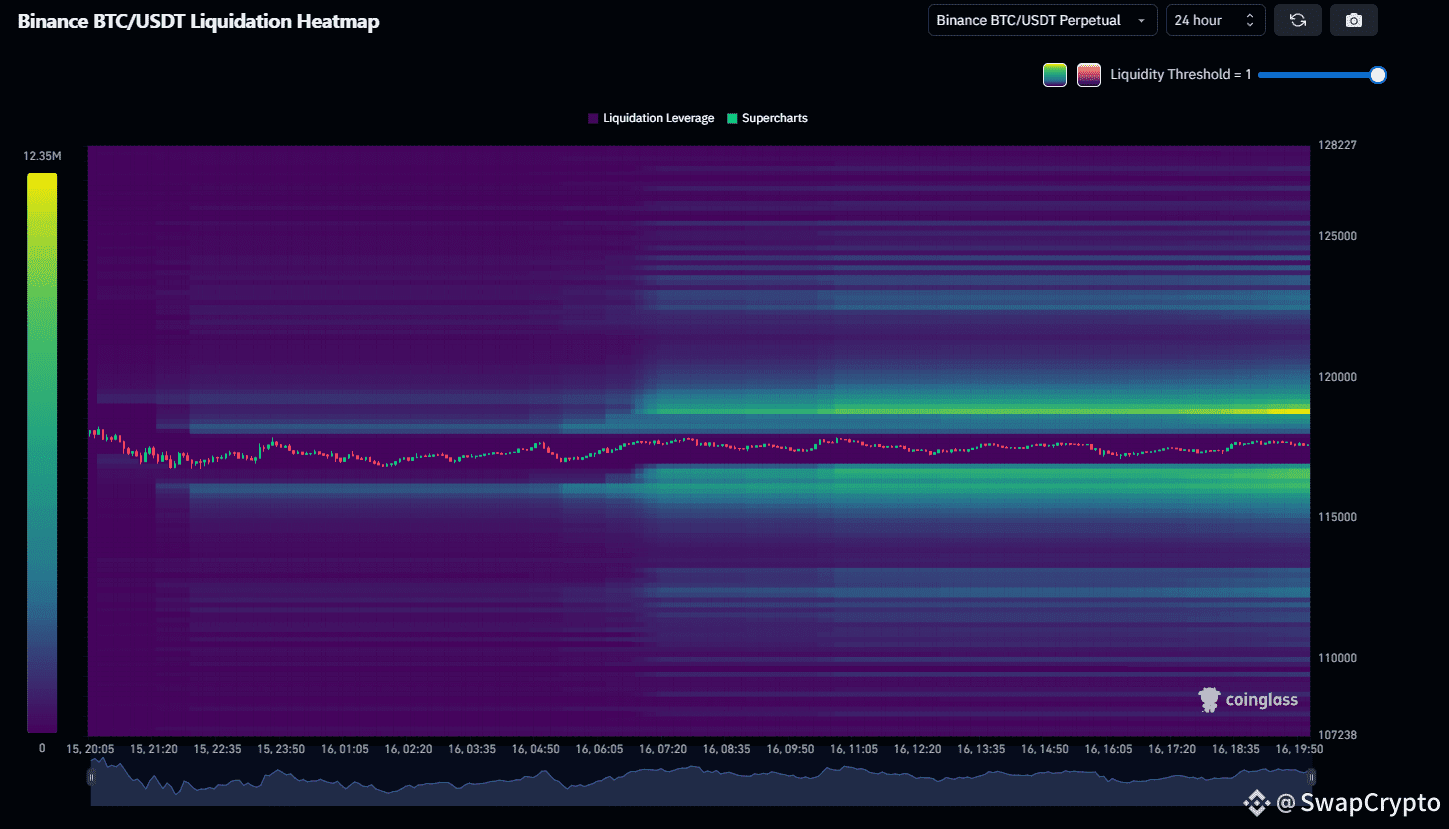
This liquidation heatmap shows heavy liquidity stacked just above $120K, meaning price is attracted there. Until that zone is cleared, BTC looks stuck and slightly pressured down.
ENTRY PRICE : 119146.67 or 120138.96
TP 1 : 114849.82
TP 2 : 112426.35
SL : 123139.51
For more details, click on my profile and check my BIO .
This signal is for spot trading only. If you're interested in future signals, join my Binance Live .
Simply click on my profile to join!
#swapcryptoz #BTC #btcupdates #BTCUSDT.