If your funds are within 500,000, and you want to succeed quickly in the cryptocurrency market through short-term trading, then please read this post carefully; after reading, you will have a sudden understanding of the essence of short-term trading!
I am 34 years old this year and have been in the market for 10 years, trading cryptocurrencies for a living for 6 years! Not choosing a finance major in college is a big regret in my life. I started learning about stocks/finance/forex and so on online in my freshman year. The colorful screens of red and green filled my life with excitement, and I became fascinated. With boundless anticipation for the market, I opened an account in my sophomore year, and gradually learned more about cryptocurrencies like Bitcoin through a classmate's introduction, feeling increasingly interested, thus beginning my investment journey.
Like most friends who have just entered the market, I was initially obsessed with technical indicators, constantly backtesting with coins to find patterns; eager to enter low-priced coins or those that have made significant retracements, believing their safety is higher. In fact, these are completely wrong perceptions of the market.
Only later did I understand that to achieve quick profits in the market, you must trade short-term. Medium to long-term compounding should be done in conjunction with it!
The conclusion is: Don't let the profit blood rush to your head; know that the hardest thing in the world is how to sustain profits. You must carefully review whether it is luck or skill; a stable trading system suitable for yourself is the way to continuous profit.
There is a saying that impressed me: If you don't occupy ideology, others will occupy it.
Today I share with you the trading mindset that has kept me standing firm in the market for a long time; if you study seriously, you will reap huge benefits and experience a dramatic change in your understanding of trading!

A must-read for beginners! 10 trading rules from veteran traders in the cryptocurrency market.
As an old trader who has been in the cryptocurrency market, I have summarized 10 rules of trading, each of which is a lesson learned through blood and tears; after reading, you can avoid losing 100,000!
1. Time difference between East and West: Stay up late to watch the coin market, which is mainly concentrated during European and American times (Beijing time 21:30-7:30), and the early morning is when the big gains happen! So, want to make money? Staying up late is a must! Sleep at 20:00, wake up at 4:00 to watch the market, this is the routine of a qualified trader.
2. Don't panic during daytime drops: Is there a significant drop during the day while foreigners are pulling the market up at night? Don't be afraid! When foreigners enter at 21:30 at night, they will pull it back in minutes! Remember: daytime drops are buying opportunities; don't chase highs during daytime rises; they are likely to drop back at night.
3. The deeper the spike, the stronger the signal: K-line spikes (long upper and lower shadows) are a common tactic of big players; the deeper the spike, the stronger the reverse signal! After the spike, it is often the best time to buy or sell, don't let the big players trick you into selling!
4. Good news leads to bad news: Before major meetings or positive news, the coin price will surely rise, but once the news is released, it will immediately drop back! So, plan ahead, and once the news is out, run quickly; don’t be greedy!
5. Community recommendations? Counter-intuitive action is correct: The coins that are wildly recommended in the group, talked about in great detail? Don't believe it! It is likely a trap! The hotter a coin is, the more cautious you should be; counter-intuitive action is the way!
6. Heavy positions lead to liquidation; light positions are the way: Holding heavy positions? Congratulations, you are already on the exchange's liquidation list! The big players specifically target heavy position users; a pull-up and a smash can liquidate you in minutes! So, diversifying with light positions is the survival strategy!
7. After the stop loss, the price drops; after the take profit, the price rises: After the short position stop loss, the price drops; after the take profit, the price rises; the big players do not want you to make money! So be cautious with stop losses, take profits in batches, and don't let the big players lead you around!
8. Just a little bit from breaking even: Don't dream: about to break even? The rebound suddenly stopped! How could the big players let you run away easily? Therefore, when close to breaking even, reduce your position appropriately; don't be greedy!
9. Excitement = waterfall warning: When you are overly excited, the waterfall is about to come! The big players use your emotions to cut the leeks; keeping calm is the way!
10. When you have no money, the cryptocurrency market is full of opportunities: When you are broke, every coin is rising, and FOMO emotions are at their peak! But remember, 80% of the market is manipulated; don't rush in easily; patience is the key to winning!

Today I share with the destined friends, hoping to provide some inspiration.
1. At the time of entry, you should not only look at the trading K-line" trend. Especially for short-term trading, you also need to look at the 30-minute K-line, while the overall market must stabilize at this moment to enter. For example, sometimes you see a K-line with a long upper shadow and feel there’s no opportunity, but the next day it pulls out a big bullish candle or even a limit up. If you look at the 30-minute K-line, you will see the mystery.
2. If the trend and order are wrong, just looking once is a mistake. Follow the trend while ensuring that the upward order is not disrupted.
3. It is better not to trade if short-term trades are not in hot or potential hotspots.
4. Give up all impulsive entries. Trade your plan, plan your trade.
5. Anyone's opinion or suggestion is merely a reference; you need to have your own thoughtful consideration and careful analysis.
6. First, lock in the direction and then select the coins. If the direction is correct, you will achieve twice the result with half the effort; if the direction is wrong, you will achieve half the result with double the effort.
7. Get involved in coins that are currently rising. Guessing the bottom is a big taboo; you always feel a rebound is imminent, but then there's another ultimate shakeout. Stock prices always move towards small resistance levels; getting involved in coins that are currently rising means choosing a direction with less resistance.
8. After making large profits or losses, empty your position and reassess the market and yourself. Clarify the reasons for the large profits or losses, and then act when it's not too late. After years of trading experience, I have found that emptying positions after large profits or losses has a success rate of over 90%.
Don't panic in trading, don't be impatient.
1. Patience is golden; don't panic in sideways markets. When the coin price seems to be stuck in one place, don't rush in. At this time, patience is your treasure. Because the good show is often yet to come, waiting is worth it!
2. Volume and price rise together, buy it! If you see a certain coin's trading volume and price breaking through previous levels and then stabilizing there, it’s like seeing a green light, hurry up and buy it!
3. Did the leading coin drop? Opportunity has come! Is the leading coin that everyone is scrambling for dropping? Don't be afraid; this is your opportunity! Grab it, maybe the next one to double will be you!
4. Gaps are a symbol of strength. If the price of a coin suddenly jumps up, leaving a gap, then its strength is very strong. If the price subsequently retraces but does not break that gap, then get ready to watch it continue to soar!
5. Stir-frying limit up? Don't be envious. Did you see another person's coin limit up? Don't be jealous; that may be a game of the big players, don't be easily fooled!
6. In a bull market, hold your coins tightly. When the bull market comes, hold your coins like you're grabbing a lifesaving straw! Don't let go easily, or you may miss a huge wave of market movement!
7. The top is not sharp, at least there is a double top. Don't rush to sell just because the price is high. A true top won't be that sharp; there will at least be a double top. Remember this, and you won't sell too early!
8. MACD dips to 0 axis, buy point appears. The MACD indicator is magical; when its DIF line dips near the 0 axis but does not break, it is a buying point! Remember this mantra, and trading will be easier!
9. The 120-day line 'upward, buy on dips. If you see that a certain coin's 120-day line is in a bullish arrangement and the trend is upward, then don't hesitate, buy on dips! The accuracy is very high!
10. Continuous small bullish candles °, the big players are in action. If a certain coin continuously shows small bullish candles, it’s like seeing the big players' secret signal. They are quietly collecting chips! At this time, you need to pay close attention!

Essential for crypto novices: A tool for identifying trends: Analysis of the structural breakout (BOS) strategy, which is also the core wealth code for my monthly income in seven figures and annual income in eight figures.
No more nonsense, let's get straight to the point!
Most profitable traders and professional traders have built their trading systems around the concept of "following the trend."
However, whether the market is trending can be easily judged by significant price increases or decreases. But the market does not always show a clear trending movement. In fact, prices are only in a clear trend 25% of the time; for the remaining 75% of the time, they are either in a sideways range or exhibit "difficult-to-judge" trends.
Fortunately, there is a reliable method to identify trends. It is a mechanical model that does not require indicators or subjective judgment from traders. It is called structural breakout (Break of Structure, BOS).
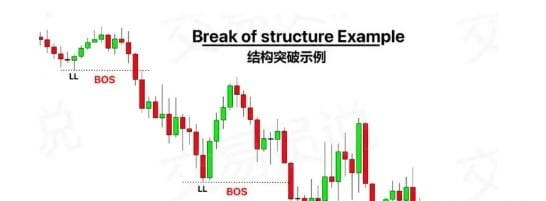
In the following sections, we will describe what a structural breakout is, how to identify it, and how to trade it.
Definition
In trading, "structural breakout" refers to the price breaking through established highs and lows in a trend, clearly indicating the ongoing order flow in the current direction. This concept is crucial in trend analysis, helping traders understand market momentum and possible future directions.
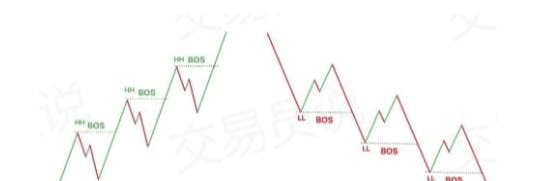
In simple terms, this is the process of forming higher highs (HH) in an upward trend, rather than first forming lower lows (LL). This situation is called a bull market structure breakout. In a downward trend, a structural breakout occurs when lower lows are formed first, followed by higher highs, which is called a bear market structure breakout. In other words, structural breakout signals indicate the continuation of market momentum or market sentiment.
The order is important. A structural breakout only counts when a higher high is formed directly without breaking the low in an uptrend. In a downtrend, a structural breakout only counts when lower lows are formed before breaking the recent high. If either of the above two situations occurs, we can consider it a market structure shift (MSS) or feature change (ChoCh).
Essentially, a structural breakout means you have received the first signal indicating that the existing trend is weakening and a reversal is about to occur.
It is important to note that structural breakouts do not only occur in trending markets. When the price breaks through key support or resistance levels, established trend lines, or even certain chart patterns, it can also be considered a structural breakout. Any situation that breaks through common structures in the market can be regarded as a structural breakout. However, in this article, we will focus on market structure breakouts in trending markets.
In this article, we will delve into structural breakouts, as it is one of the most fundamental concepts in smart money trading.
Basic market structure
Market structure refers to the way prices change over time. There are mainly three types:
1. Uptrend: When the price continues to rise, you will see continuous new highs, and the price will not fall below previous lows.
2. Downtrend: In contrast to an uptrend, the price continues to fall, creating new lows, and the price will not break above previous highs.
3. Range-bound: In this case, prices fluctuate up and down within a certain range but do not create new highs or lows.
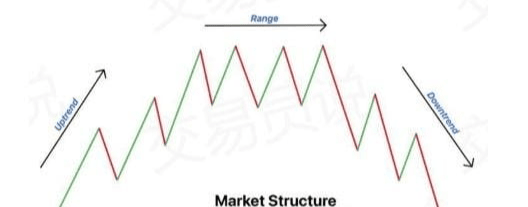
The concept of "structural breakout" is actually only meaningful in uptrends and downtrends. It occurs when the price breaks through significant highs in an uptrend or significant lows in a downtrend. This is a signal indicating that the trend is strong and may continue. However, in sideways markets, the price does not create new highs or lows, so structural breakouts do not apply.
Types of structural breakouts
Based on the direction and the situation of the breakout, structural breakouts can be classified into two types:
Bull market structure breakout (Bull BoS):
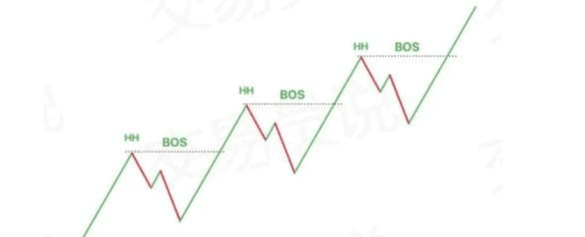
When the price breaks above swing highs in the trend, it indicates strong upward momentum and suggests that the bull market (upward trend) may continue.
Bear market structure breakout (Bear BoS):
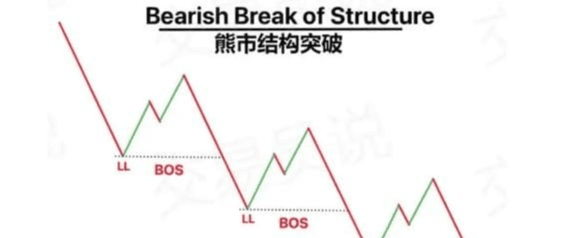
Conversely, when the price breaks below swing lows, it indicates strong downward momentum, possibly suggesting that the bear market (downward trend) will continue.
The difference between bull and bear market structure breakouts
The lower section distinguishes between bull market structure breakouts and bear market structure breakouts:
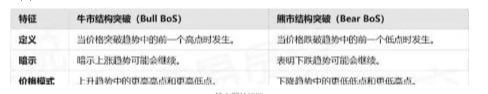
Meaning
"Structural breakout" helps predict whether the market will continue the existing trend or reverse direction. This insight has several important aspects:
1. Predicting market direction:
By identifying structural breakouts, traders can anticipate whether the current trend will continue or if the market is about to reverse. This understanding allows their strategies to remain aligned with potential future market movements.
2. Trade in cooperation with market makers:
Identifying confirmed structural breakouts allows traders to align their trades with the actions of market makers. When a structural breakout confirms a trend continuation, traders can more easily and confidently trade in that direction.
3. Grasping entry and exit timing:
Structural breakouts can also serve as important signals for timing market entries and exits. For example, a bull market structure breakout indicates a good entry point in an upward trend, while a bear market structure breakout may be a favorable time to exit or establish a short position.
Overall, understanding and utilizing structural breakouts can not only enhance the ability to predict market trends but also align trading strategies with the powerful forces driving market fluctuations, thus increasing the potential for successful trades.
How to apply structural breakouts in trading?
Effectively trading structural breakouts requires combining them with other strategies to improve the accuracy of predicting future price direction. Here is a simplified explanation of how to combine structural breakouts with moving averages and candlestick pattern strategies:
1. Set up
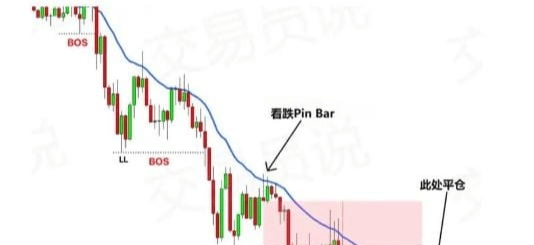
First, identify lower lows and lower highs in a downward trend. Add a 21-period exponential moving average (EMA) to the chart.
2. Identifying structural breakouts
When the price breaks below these lower lows, a structural breakout occurs. This indicates that the price may continue to move downward.
3. Execute sell trades
After a bearish structural breakout appears, wait for a bearish candlestick pattern to form, such as a bearish engulfing pattern or Pin Bar. This is your signal to enter a sell trade.
4. End trading
Monitor the relationship between price and EMA. When the price breaks through EMA, it means the trend may change or momentum may be lost, at which point you can close your position.
Please remember that this strategy is just an example to help you understand how to incorporate structural breakouts into trading. It is important to develop and test your strategies based on your trading style and risk tolerance. Incorporating structural breakouts as part of a broader strategy can enhance the effectiveness of trades by providing additional confirmation of market trends.
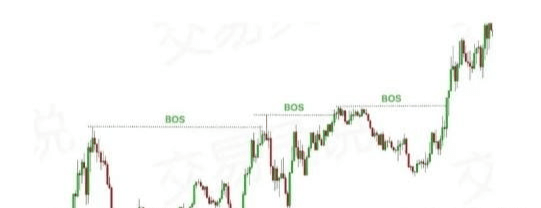
Case study: Trading with bull market structure breakouts and demand zones
In this trade, we observed a clear bullish structure breakout (Bull BoS) in the market. When the price broke through the previous significant high, it indicated strong upward momentum.
Identification of Bull BoS:
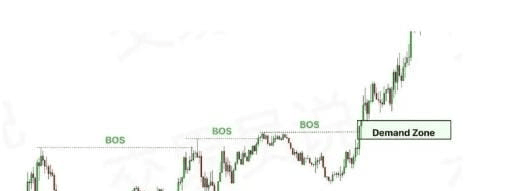
◎ The market is in an upward trend, creating higher highs and higher lows.
◎ When the price breaks above the recent highs, it confirms the Bull BoS, indicating that the upward trend may continue.
Formation of demand zones:
◎ After the BoS forms in a bull market, the price pulls back to the breakout area, forming what is called a demand zone.
◎ This demand zone is located near the area where the BoS occurred, thus becoming a key level for potential order accumulation.
Trade execution:
◎ After observing the price trend, wait for the price to return to this demand zone.
◎ As expected, the price entered the demand zone and began to show signs of order accumulation. This is my signal to prepare for a buy trade.
Trading results:
◎ After filling orders in the demand zone, the price began to fluctuate upwards.
◎ This volatility confirms my analysis
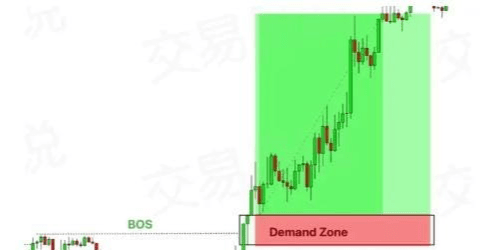
A buy trade was executed under strong upward momentum.
◎ This trade offers a high risk-reward ratio, as the entry point in the demand zone provides a clear stop-loss position, and due to the confirmed upward trend, the potential for upward movement is also considerable.
How to operate structural breakouts in cryptocurrency trading?
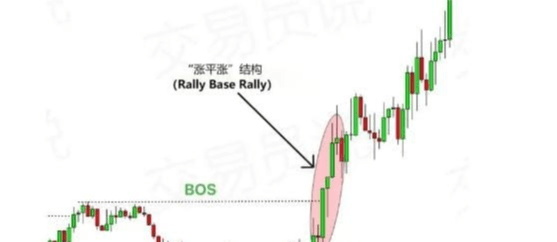
In a bull market, when the price breaks through the structure, you should mark the inducement area (in price action trading, an inducement is a smart money trap, which can take the form of order blocks, supply and demand zones, or support and resistance areas) and wait for the price to pull back to that area and rebound.
When the price touches the inducement area, you can look for confirmation signals for buy trades in lower time frames, such as market structure shifts (MSS) or trend reversals.
In a bear market, when the market breaks through the structure, you should mark the inducement area and wait for the price to pull back to that area and rebound.
When the price touches the inducement area, you can look for confirmation signals for sell trades in lower time frames, such as market structure shifts (MSS) or trend reversals.
ICT MSS and BoS
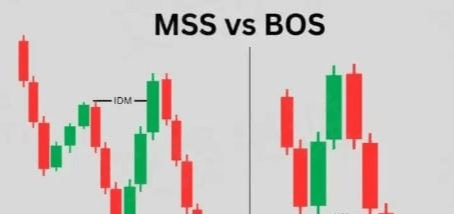
As we discussed earlier, structural breakouts indicate that after breaking through the inducement area, the previous structure (highs/lows) has been breached.
The ICT market structure shift (MSS) indicates a breakout of swing lows or swing highs.
Therefore, the difference between structural breakouts and market structure shifts lies only in the inducement area.
Structural breakouts indicate larger changes in price trends, while market structure shifts indicate preliminary changes in structure.
You can refer to the image below to understand the difference between BoS and MSS:
Conclusion
Overall, "structural breakout" is a very important concept in price action trading. It helps us judge whether the market will continue to rise or fall. We understand that combining structural breakouts with other tools (such as demand zones or candlestick patterns) can make our trading strategies more effective.
Remember, structural breakouts are a great guide, but they work best when combined with your own trading plan. The key is to better understand the market and make more informed trading decisions. By continuously practicing this concept, you will master how to leverage it to your advantage in trading.
When trading using the structural breakout strategy, we should remember that no strategy is foolproof, so all account funds should not be invested in this strategy.
Additionally, to reduce risk, you should always set stop losses to protect your principal.


