Some fans have suggested whether the MVRV extreme deviation range algorithm of Bitcoin can be used to define the price range of Ethereum. Based on data from the past year, I have drawn a model, and the backtest results show that this method has certain reference value in judging phase trends.
The previous trend ended on December 7, 2024, when ETH encountered resistance and fell back before approaching the orange line, dropping to the yellow line and gaining temporary support. The price subsequently oscillated repeatedly around the yellow line, turning from support to resistance, ultimately choosing to continue downward after being blocked during the rebound; although the green line was briefly broken, it did not form durable support.
This round of increase started in April, first stabilizing near the blue line, then breaking through the green line and retesting it for stability, establishing an upward pattern; after breaking through the yellow line, it also retested without breaking, continuing the upward rhythm.
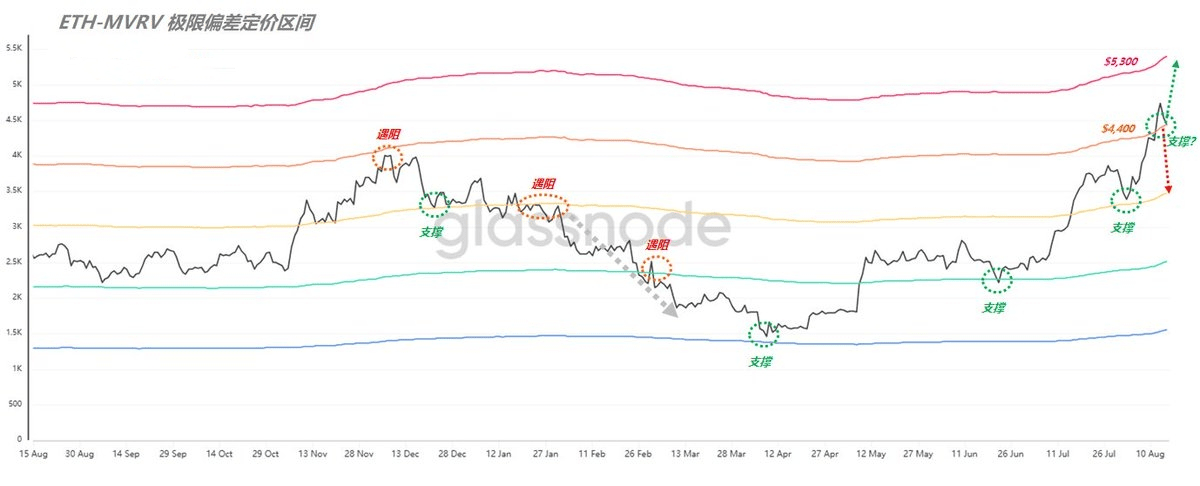
(Figure 1)
As of August 12, the ETH price has crossed the orange line ($4,400), and during the pullback yesterday, it touched but did not break this level. If the orange line support is effective, the next target will aim directly at the red line ($5,300); if it fails and forms a tug-of-war pattern, one must be cautious as the orange line may turn into a new resistance area, reducing the probability of trend continuation.#ETH🔥🔥🔥🔥🔥🔥
