$BTC The daily chart shows that Bitcoin (BTC) is retreating from a local peak at $124,517 after forming a potential double top.
The last candle represents a bearish engulfing pattern with increased volume, signaling strong selling pressure.
The relative strength index (RSI) at 55.1 remains neutral, indicating a lack of overbought or oversold conditions, while the MACD level at 1,224.5 signals a bullish phase.
The daily structure suggests caution, with confirmed breakdown below $117,000 possibly opening the path to $113,000–$115,000. At the same time, a sustained recovery to $119,500–$120,000 on high volume may reignite bullish momentum.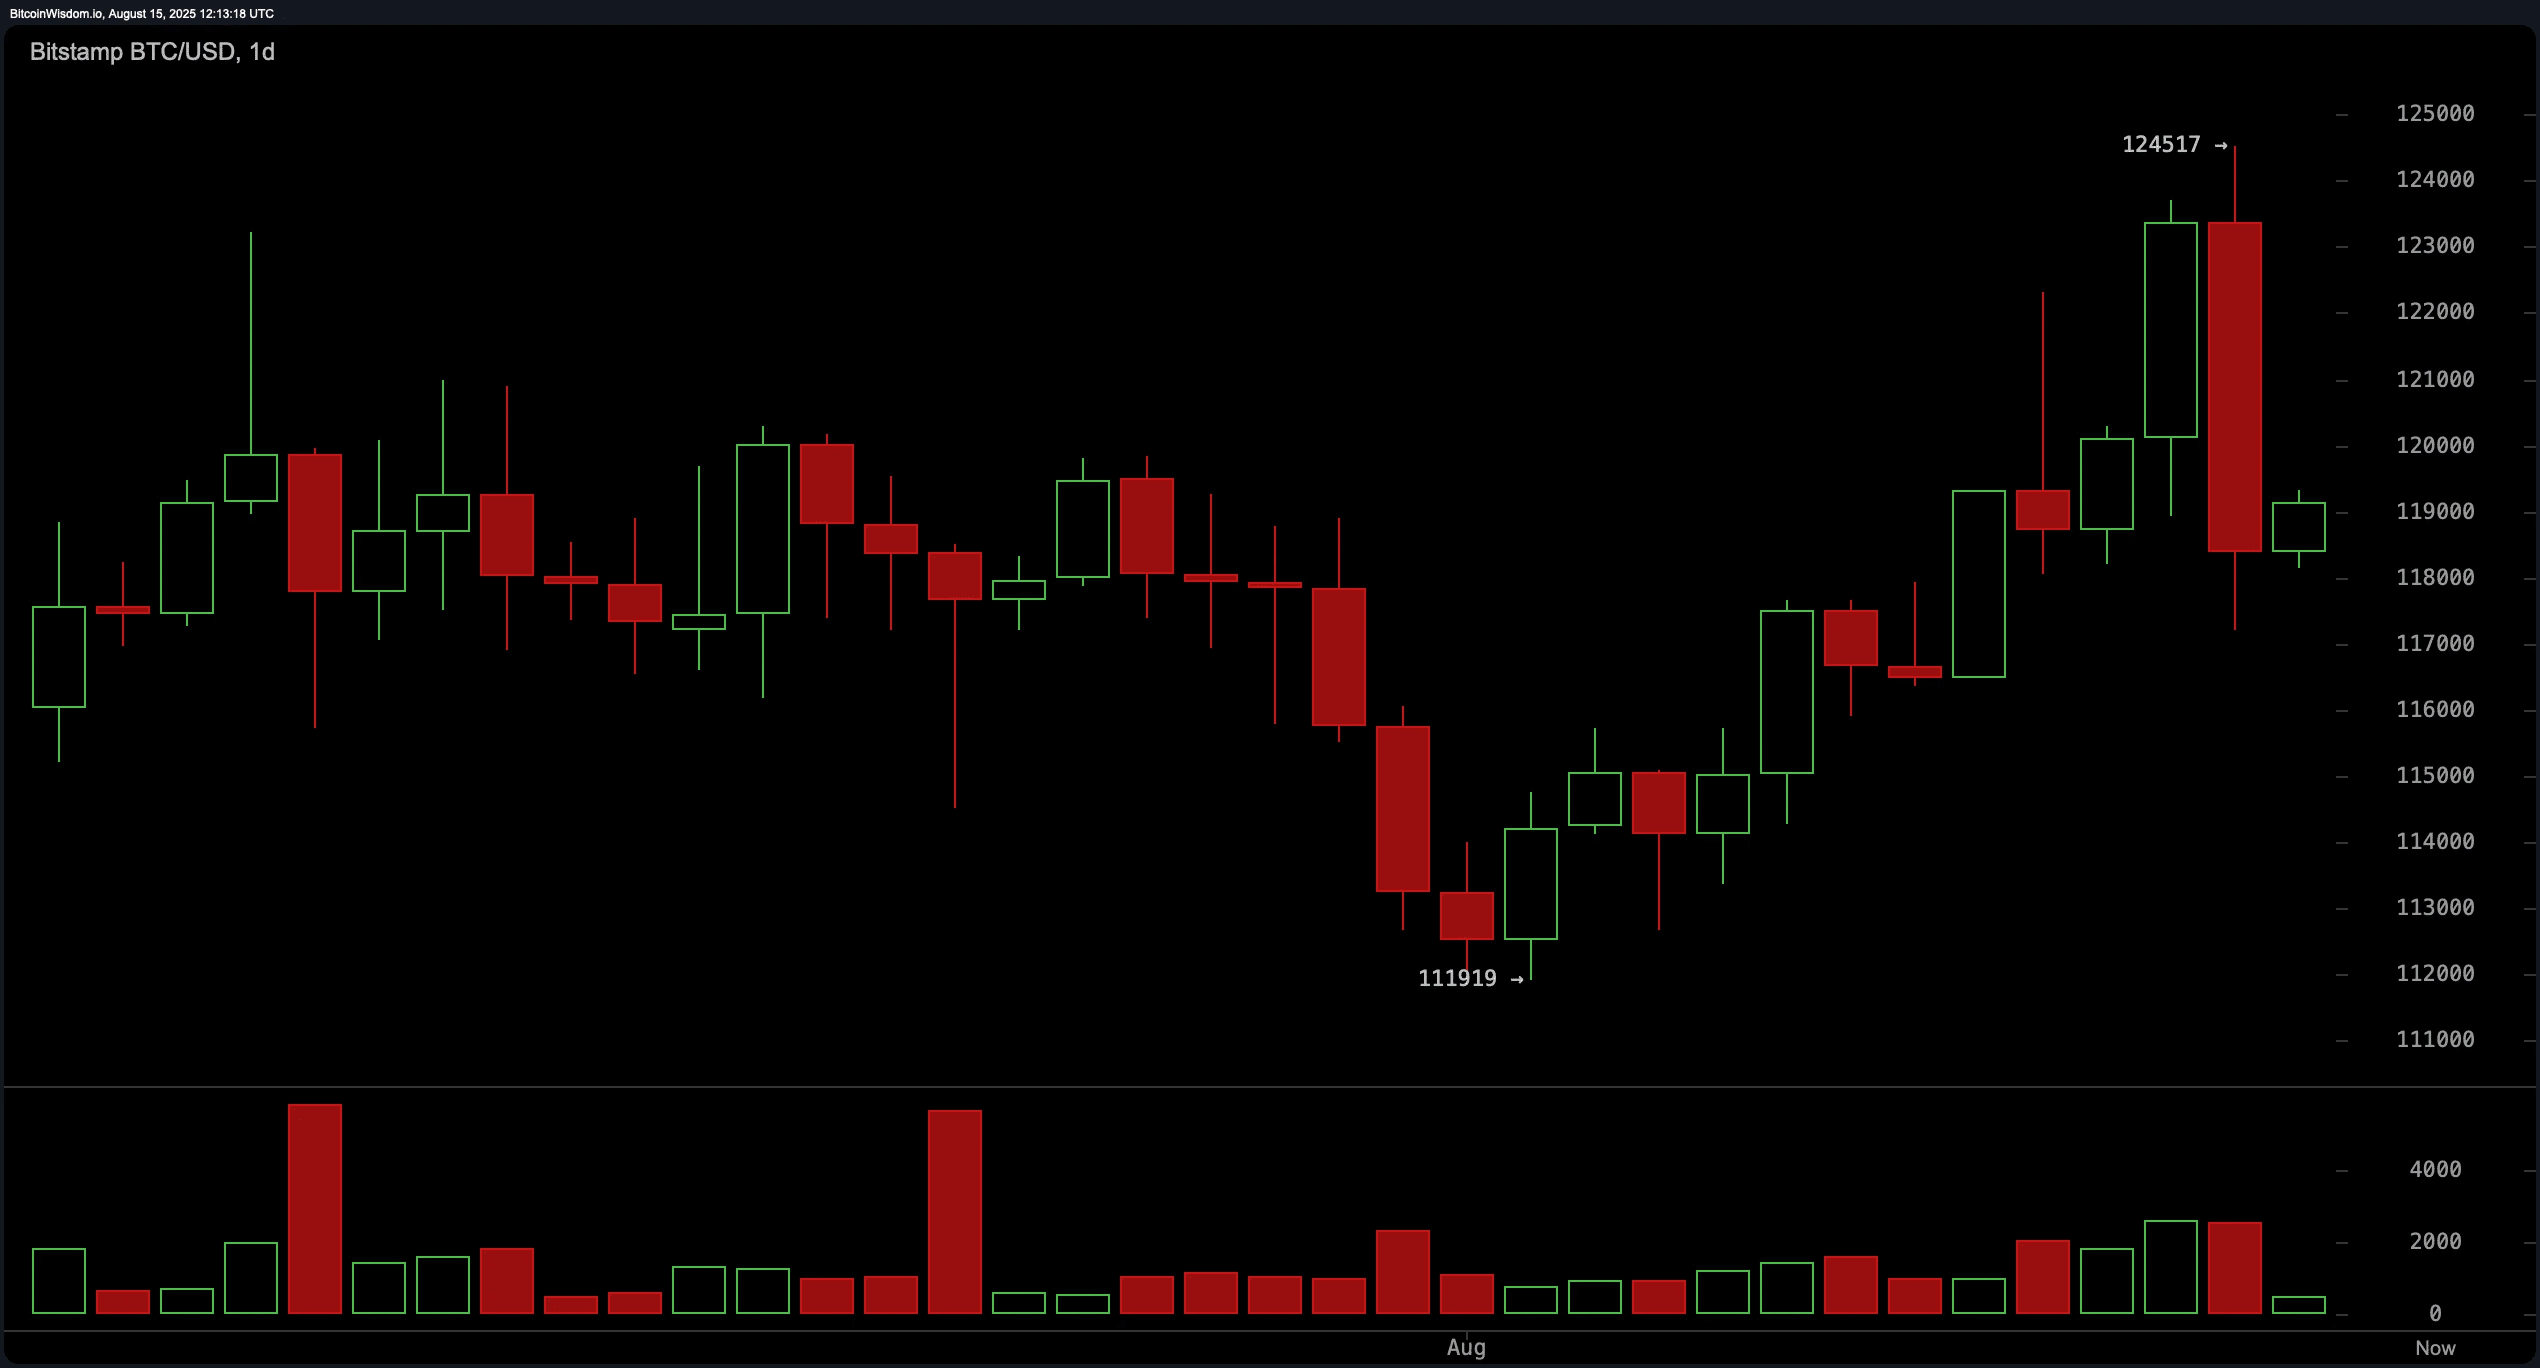
==========
The 4-hour chart of Bitcoin highlights a more immediate bearish tilt.
Since reaching $124,517, lower highs are forming, with red volume spikes during sell-offs and weaker green volumes on bounces.
Neutral readings from the stochastic oscillator at 68.7 and the commodity channel index (CCI) at 57.9 indicate a lack of strong momentum, but positive signals from exponential moving averages (EMAs) and simple moving averages (SMAs) across all periods reflect long-term trend support.
Traders are watching for a recovery to $120,000–$121,500 to realize a breakout scenario, while failure to hold at $119,500 may lead to a new decline to $116,000.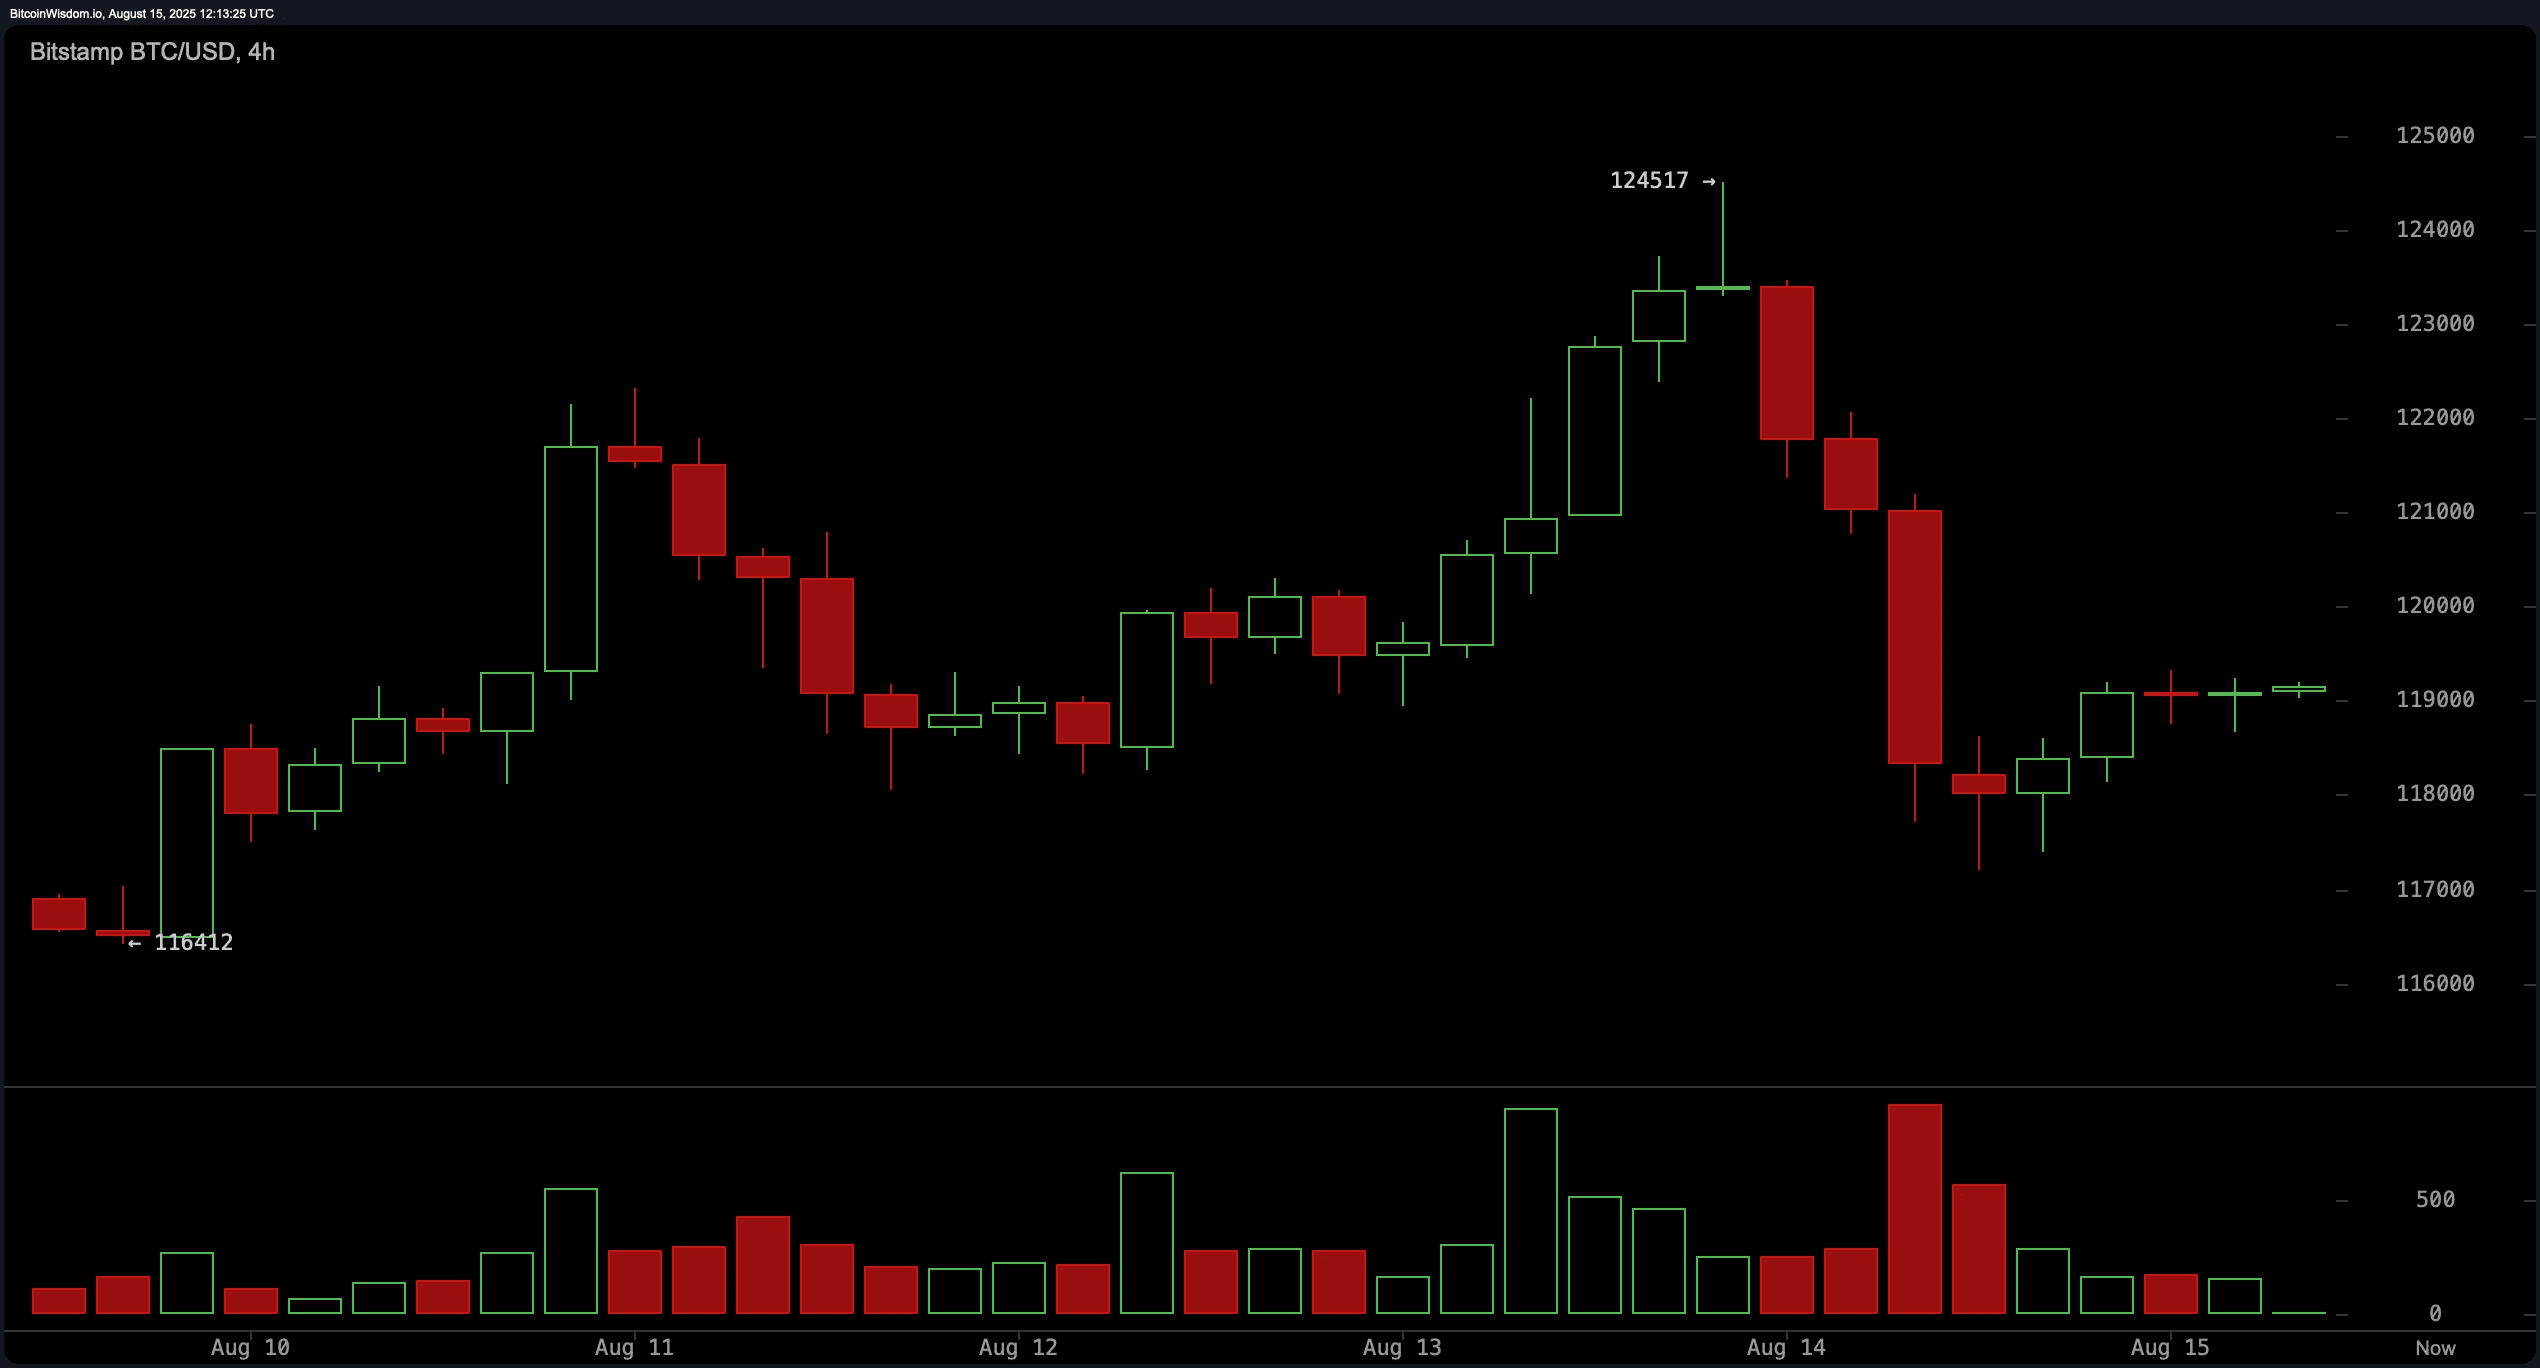
===========
On the hourly chart, Bitcoin is oscillating between $117,800 and $119,300 after a sharp drop from $124,000.
Volume remains low in the range, indicating market uncertainty.
The momentum indicator at 5,055.0 signals a bullish opportunity, supporting the potential for intraday reversals, while the Awesome oscillator at 2,431.5 is nearly neutral, reflecting a lack of a dominant trend.
Scalping traders may consider long positions around $117,800–$118,000 upon volume confirmation or short positions from $119,300 if bullish momentum fails.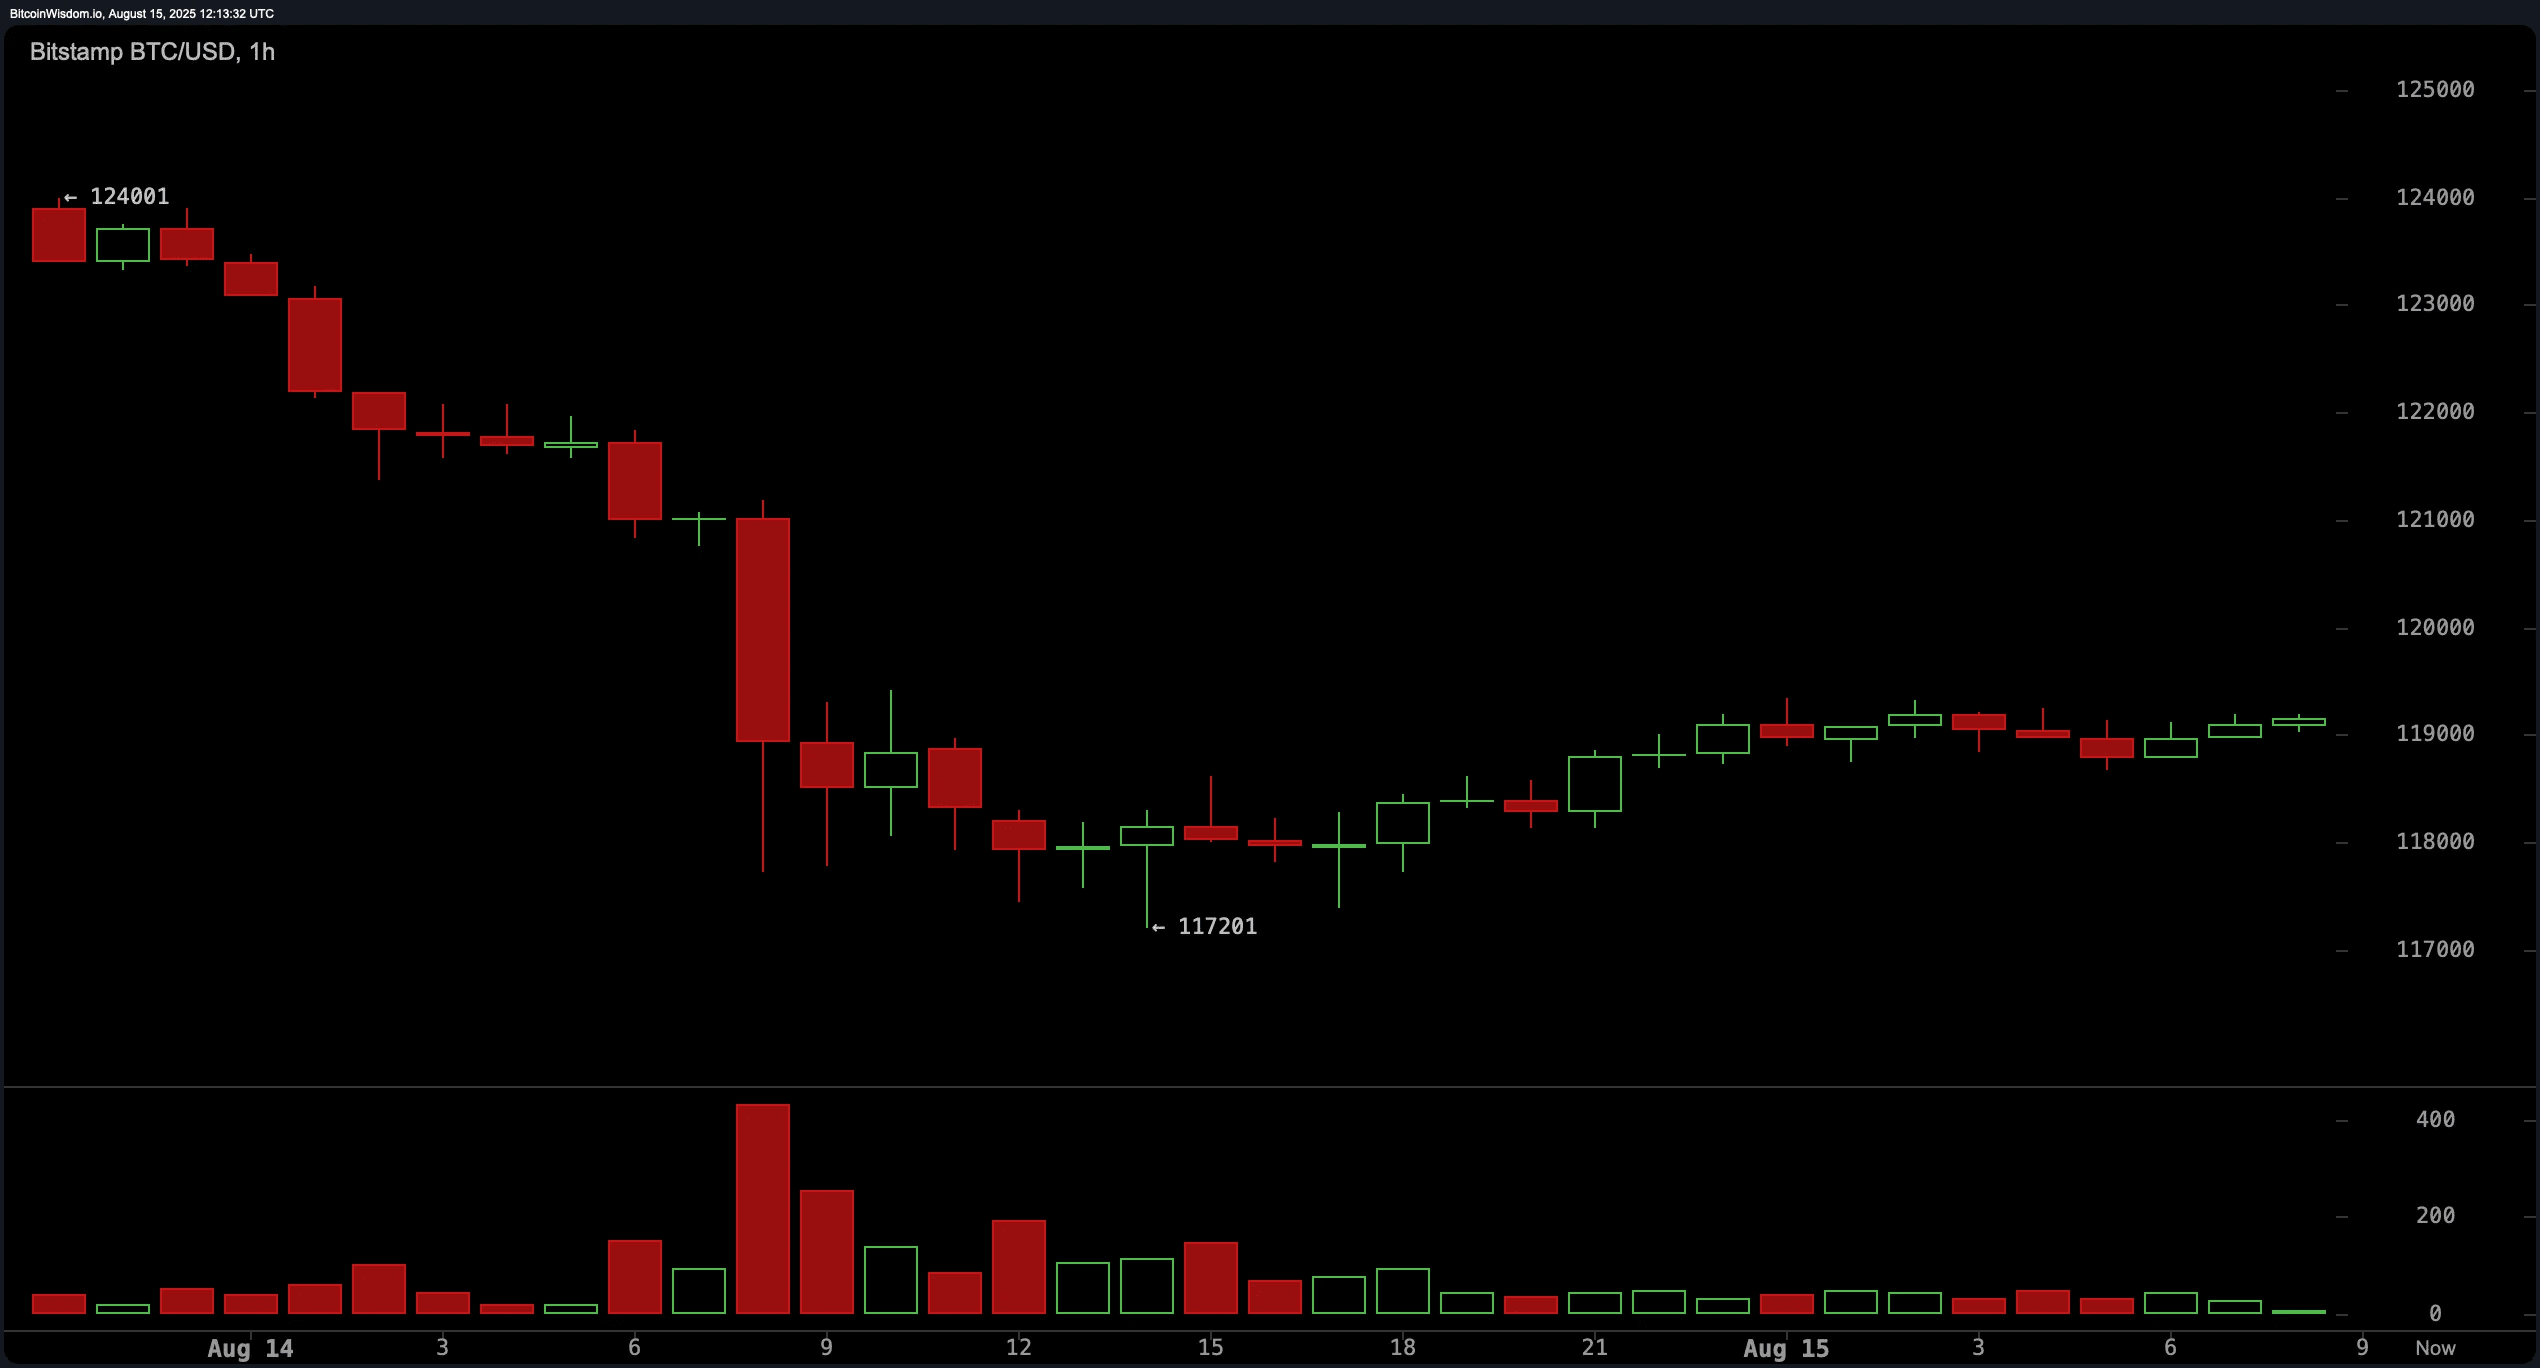
========
Overall, the short-term technical picture of Bitcoin reflects a market at a crossroads between consolidation and a potential breakout.
Oscillators show mixed and neutral signals, while moving averages clearly lean towards a bullish trend.
The nearest levels to watch are $119,500–$120,000 on the upside for confirmation of a breakout and $117,000 on the downside for a possible transition into a deeper correction.
Until a decisive move occurs, disciplined trading within the range with volume confirmation remains a reasonable approach.
=====≈======
Bullish verdict:
If Bitcoin can recover and hold above $120,000 with strong buying volume, the alignment of all key moving averages in the buying zone supports continuation to $122,000–$124,000.
Momentum indicators such as MACD and momentum remain in the bullish zone, suggesting that the broader upward trend may resume if resistance is decisively overcome.
=/=====/===
Bearish verdict:
Failure to break and hold above $119,500 combined with a daily close below $117,000 will confirm the recent bearish engulfing pattern and potential double top formation.
In this case, target levels for declines between $113,000 and $115,000 become relevant, with decreasing volume on bounces signaling a weakening of bullish participation.
