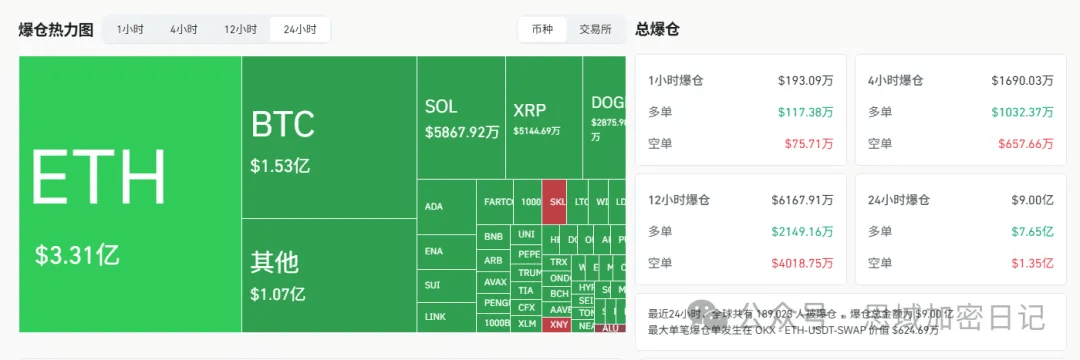
Market sentiment changed overnight, Bitcoin fell from its historical high, and the total liquidation amount exceeded $1 billion. I stared at the blood-red K-line on the screen, my palms sweaty.
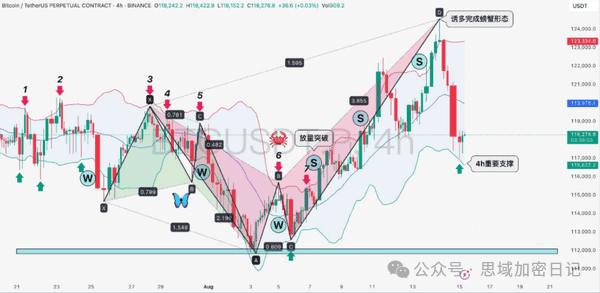
Last night in the crypto world felt like being suddenly hit by a storm. I watched Bitcoin's price plummet from a record $124,500 to below the key support of $117,500 in just a few hours, reaching a low of $117,180, with a drop of over 7,000 points like a knife stabbing the bulls.
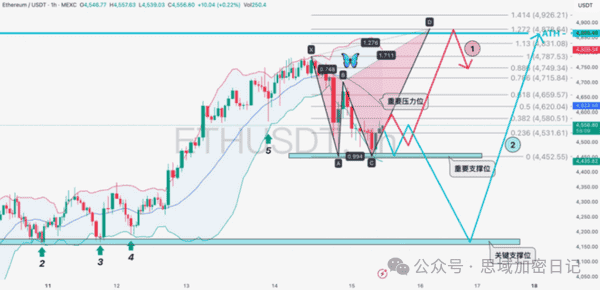
Ethereum also suffered severely, plummeting from a high of $4,788 to a low of $4,451, and is now struggling around $4,600.
The most shocking number is: in the past 24 hours, a total of 189,000,221,517 people were liquidated globally, with a total liquidation amount reaching $900 million. The wails of contract players could almost pierce through the screen.
Why did the market suddenly crash at the scene of the plummet?
This flash crash was not caused by a single factor, but rather the result of multiple negative factors overlapping.
The specter of inflation returns, and rate cut expectations are thwarted.
The trigger was the recently released U.S. PPI data—July's producer price index surged 0.9% month-on-month, marking the largest increase since June 2022, and core PPI also far exceeded expectations.

Upon careful analysis of the data, I found that this directly leads to two major consequences: inflation expectations are rising again, and rising corporate costs will eventually be passed on to the consumer side, putting pressure on the CPI. The shadow of September's rate cut looms, and the market's fantasy of a 50 basis point cut has completely evaporated; institutions generally believe that a 25 basis point cut would be a good outcome.
CME FedWatch tool shows the probability of a rate cut by the Fed in September plummeting to 90%, with a 50 basis point cut basically ruled out.
Capital outflow resonates with technical deterioration.
Worse still, the U.S. spot ETF ended six consecutive days of net inflow, with a single-day net outflow of $293 million.
When the key support of $117,500 was breached, it immediately triggered a chain reaction of programmed sell orders, forcing the liquidation of $880 million in long positions within 24 hours.
Professional players and retail investors, experiencing polar opposites.
Interestingly, professional investors and retail investors have completely different reactions to the crash.
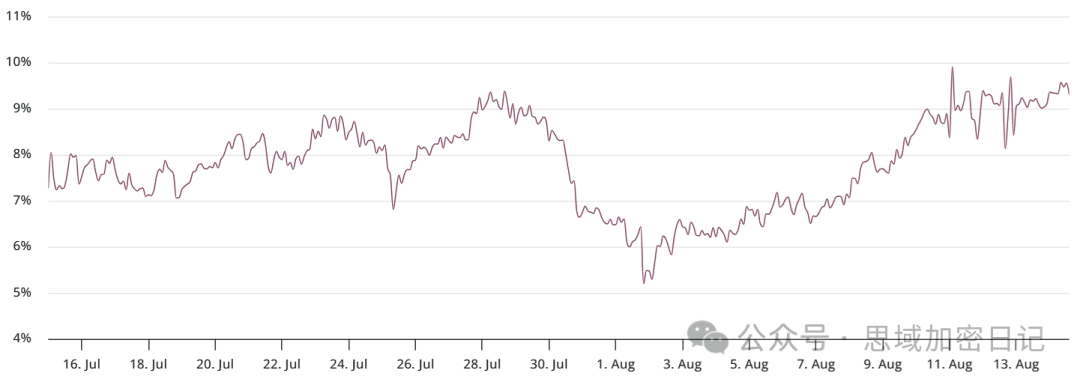
The calm paradox of the derivatives market.
While retail investors panic and sell off, professional traders remain unusually calm. Bitcoin futures' annualized premium stabilizes at 9%, maintaining a neutral range of 5%-10%.
A more obvious confidence signal comes from the options market: Bitcoin's 30-day option delta skew is just 3%, far below the 6% bearish threshold. This means institutional investors have not massively purchased put options to hedge risks.
The greed moment of whales.
On-chain data reveals the movements of smart money. I observed that whale addresses holding over 1,000 BTC accumulated 18,000 Bitcoins during the crash, with costs concentrated in the range of $118,000-$120,000.
"The reverse layout of this 'smart money' lays the groundwork for a market rebound." When others are fearful, the whales are greedy.
Altcoins face a bloodbath; can September turn the tide?
Bitcoin and Ethereum plummet, and the altcoin market is even more miserable.
Complete rout and capital rotation.
Ethereum ecosystem tokens like REZ, SSV, and ORDI generally plummeted over 15%, forming a complete rout. I noticed a key signal: Bitcoin's market share has dropped from about 65% mid-year to around 59% currently.
Coinbase's institutional department's latest report points out that this indicates the early stage of capital flowing into altcoins. Their global research head, David Duong, predicts: "We may be just weeks away from the full onset of altcoin season."
September counterattack?
The report further predicts that from September onwards, other cryptocurrencies will replace Bitcoin as the dominant force in the market.
CoinMarketCap's altcoin season index is currently only in the 40s, far below the 75-point threshold for determining altcoin season.
However, if market confidence is established, funds may flow down the risk curve. After the darkest moment for altcoins, perhaps the greatest opportunity lies ahead.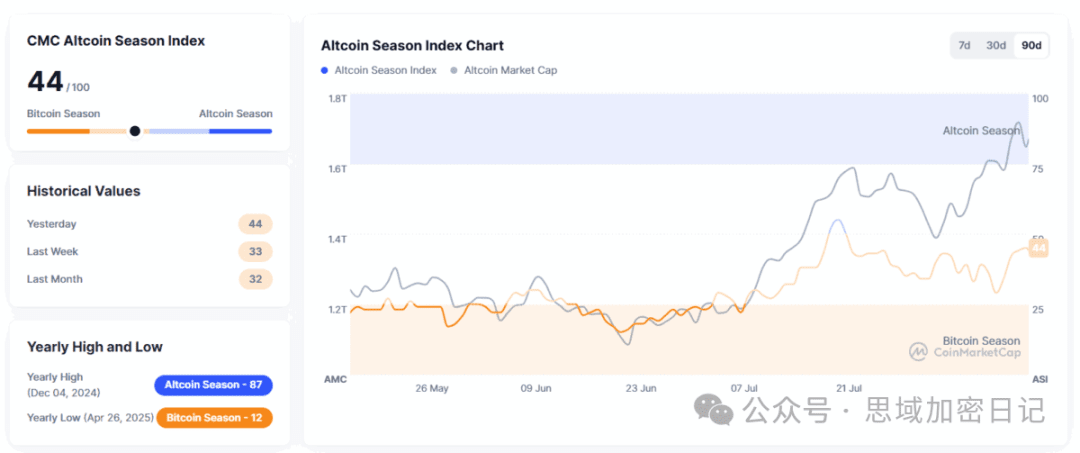
Key support and resistance levels, my trading strategy.
In the face of violent fluctuations, I have formulated a clear trading plan.
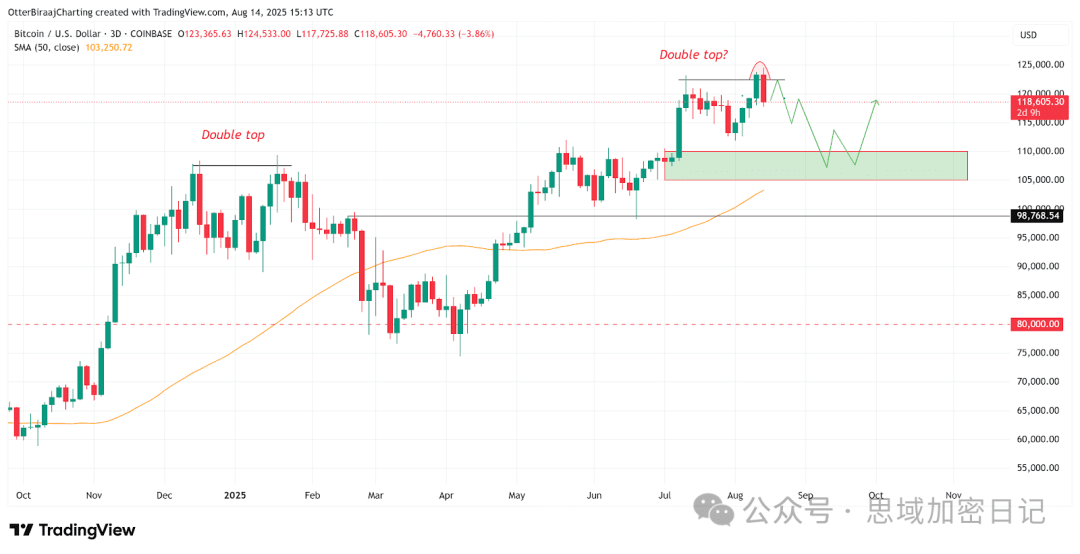
Bitcoin: A critical watershed.
Currently, Bitcoin is in a phase of oversold rebound, but the current rise is more of a short-term rebound rather than a true trend reversal. Here are a few key levels I am watching:
The line of life and death is at $116,000: if the daily line breaks effectively, it will be a direct short.
Ideal buying zone: $116,188 to $115,188, orders can be placed in advance.
Upper resistance levels: $118,000 and $121,600.
Ethereum: Two script choices.
ETH broke a significant support level in the 1-hour chart last night, with the two support levels around $4,450 being particularly critical. There are two possible trends ahead:
Red script (optimistic): Break through the midline resistance in the 1-hour chart and surge to a new historical high.
Blue script (cautious): Form a descending continuation channel between $4,450 and $4,600; if it breaks down, it will retest $4,200.
"I prefer the red script," a trader said in an analysis, "considering testing longs with stop-losses to make an impact. Remember, always protect your positions well."
After the crash, where is the market heading?
Based on various information, I have three basic judgments about the future market.
Standard Chartered still maintains an optimistic forecast for Bitcoin, expecting BTC to break the $200,000 mark by the end of 2025. The bank also raised its target price for Ethereum from $4,000 to $7,500 by the end of 2025.
However, the short-term trend depends on two key signals: the Fed's rate decision in September will determine liquidity thrust, and whether Bitcoin's market cap dominance breaks 70% will indicate the boundary of market risk appetite.
On-chain data also provides some hope. 74% of circulating Bitcoin has been locked for over two years without being used, and about 75% has remained dormant in the past six months. This historic hoarding behavior has significantly compressed the tradable supply, creating conditions for a subsequent rise.
Summary
The market is focused on the key support level of $112,000. This is not only the dividing line between bulls and bears, but also a touchstone for testing whether Bitcoin's 'digital gold' narrative can continue.
The divergence in sentiment between professional traders and retail investors reveals a fundamental disagreement among market participants regarding the nature of the crash—professional investors view it as a healthy adjustment, while retail investors are caught in panic selling.
During the crash, whale addresses holding over 1,000 BTC accumulated 18,000 Bitcoins. While most people sold out of fear, calm institutional funds were quietly preparing for the next round of market activity.
As the Fed's rate cut window approaches in September, this crash triggered by inflation data may be a brutal baptism for cryptocurrencies on their path to becoming mature financial assets.