

Ethereum corrected by more than 2% in the last 24 hours, briefly falling below $4,500 before recovering to trade above $4,600. The drop occurred amid a broader slide in the crypto market that wiped out over $240 billion in value and triggered nearly $1 billion in liquidations.
However, despite the strong selling pressure, Ethereum's technical and on-chain signals suggest that buyers still hold the advantage.
Second largest annual inflow to exchanges signals selling pressure
Ethereum saw 2,594,168 ETH move to exchanges on August 14, marking the second largest inflow in a single day of 2025, behind only the peak of 3,264,688 ETH on February 3.
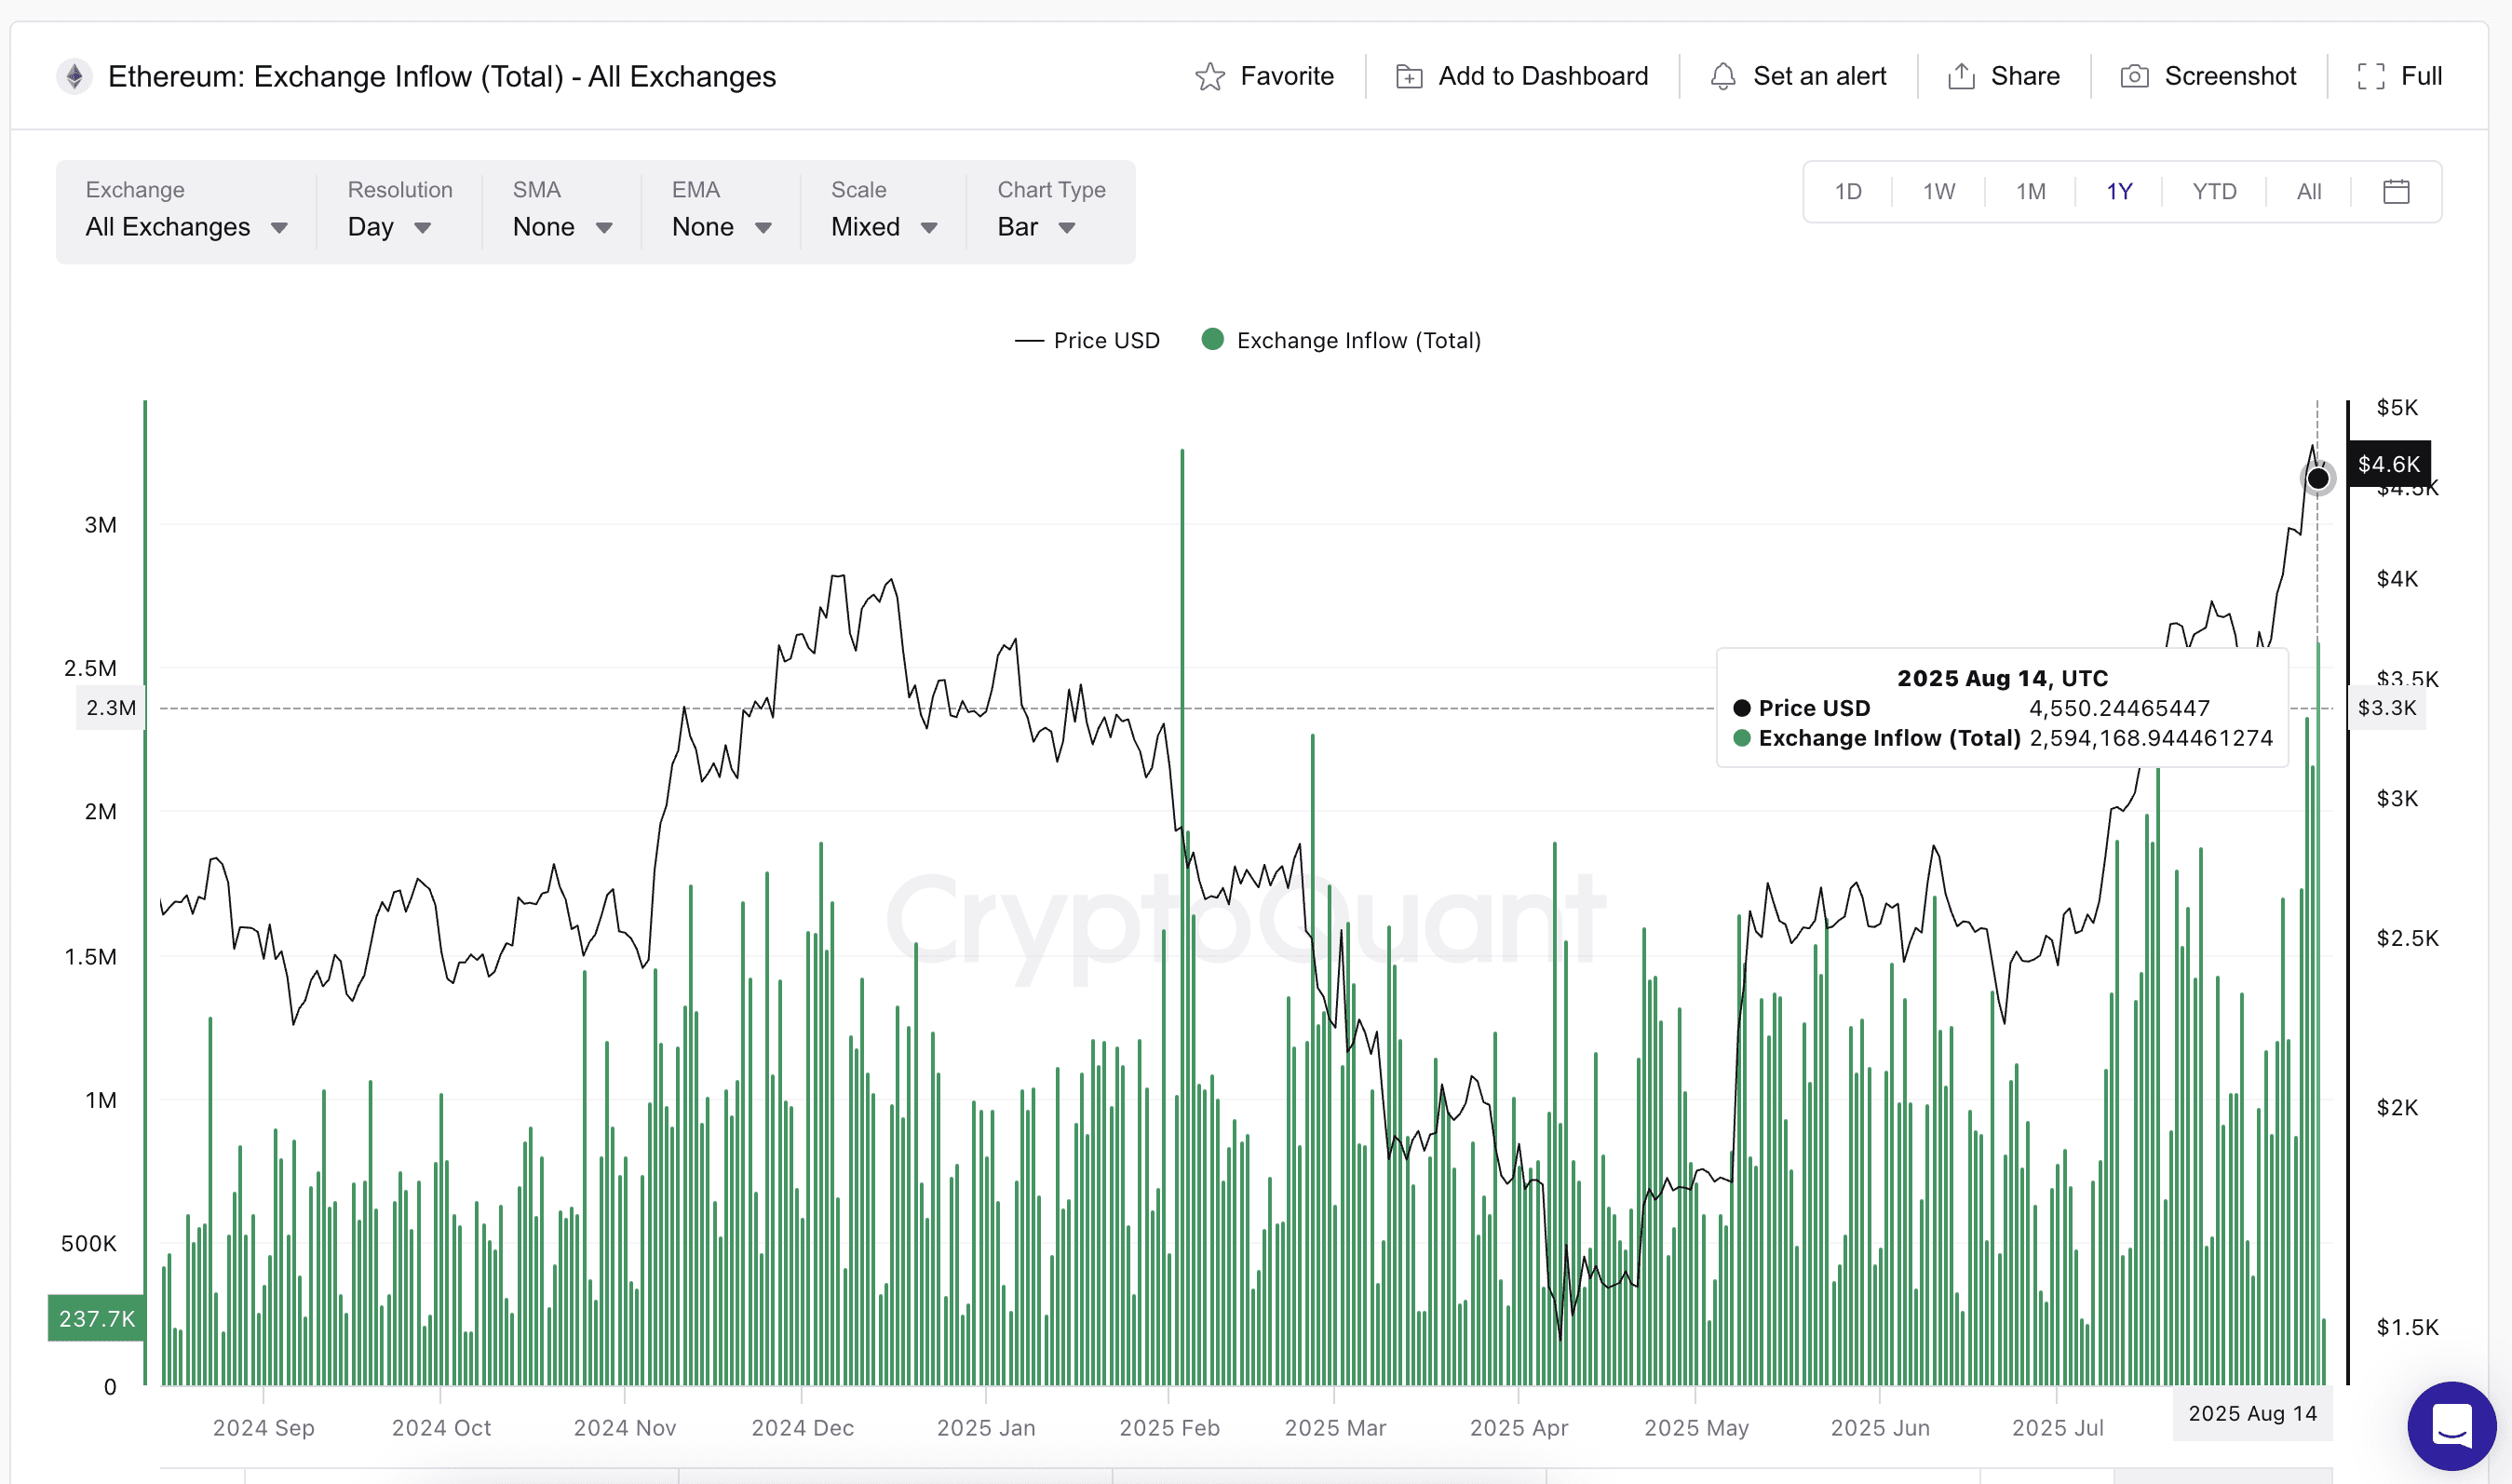 Ethereum price and increasing inflows: Cryptoquant
Inflows to exchanges generally signal potential selling pressure, and this increase was partially driven by wallets from the Ethereum Foundation, which have been some of the largest sellers recently.
The #EthereumFoundation-linked wallet(0xF39d) sold another 1,300 $ETH($5.87M) at $4,518 ~11 hours ago.
Over the past 3 days, this wallet has sold a total of 6,194 $ETH($28.36M) at an average price of $4,578.https://t.co/4hfCWymHVG pic.twitter.com/ErUyEY8SJy
— Lookonchain (@lookonchain) August 15, 2025
Historically, high local inflows lead to price corrections, as seen in the first part of 2025. At that time, the price of Ethereum was in a downtrend, and each local top in exchange inflow led to a sharper decline.
Things were different on July 18 (2,381,361 ETH) and August 12 (2,335,642 ETH), two current local tops driven by inflows. Unlike the peaks driven by the downtrend in February, these recent inflows occurred in an uptrend, a context where selling pressure is being offset by strong buying power. This buying absorption is now the critical factor keeping Ethereum's bullish structure intact.
Large investor inflows show buying power absorbing supply
Reinforcing this absorption narrative, the inflows from large investors — addresses that hold at least 0.1% of the total ETH supply — remain strong. Despite a slight drop on August 13, the seven-day change is +98.71%, and the 90-day change has risen +255.27%. These wallets are known to aggressively accumulate during downturns.
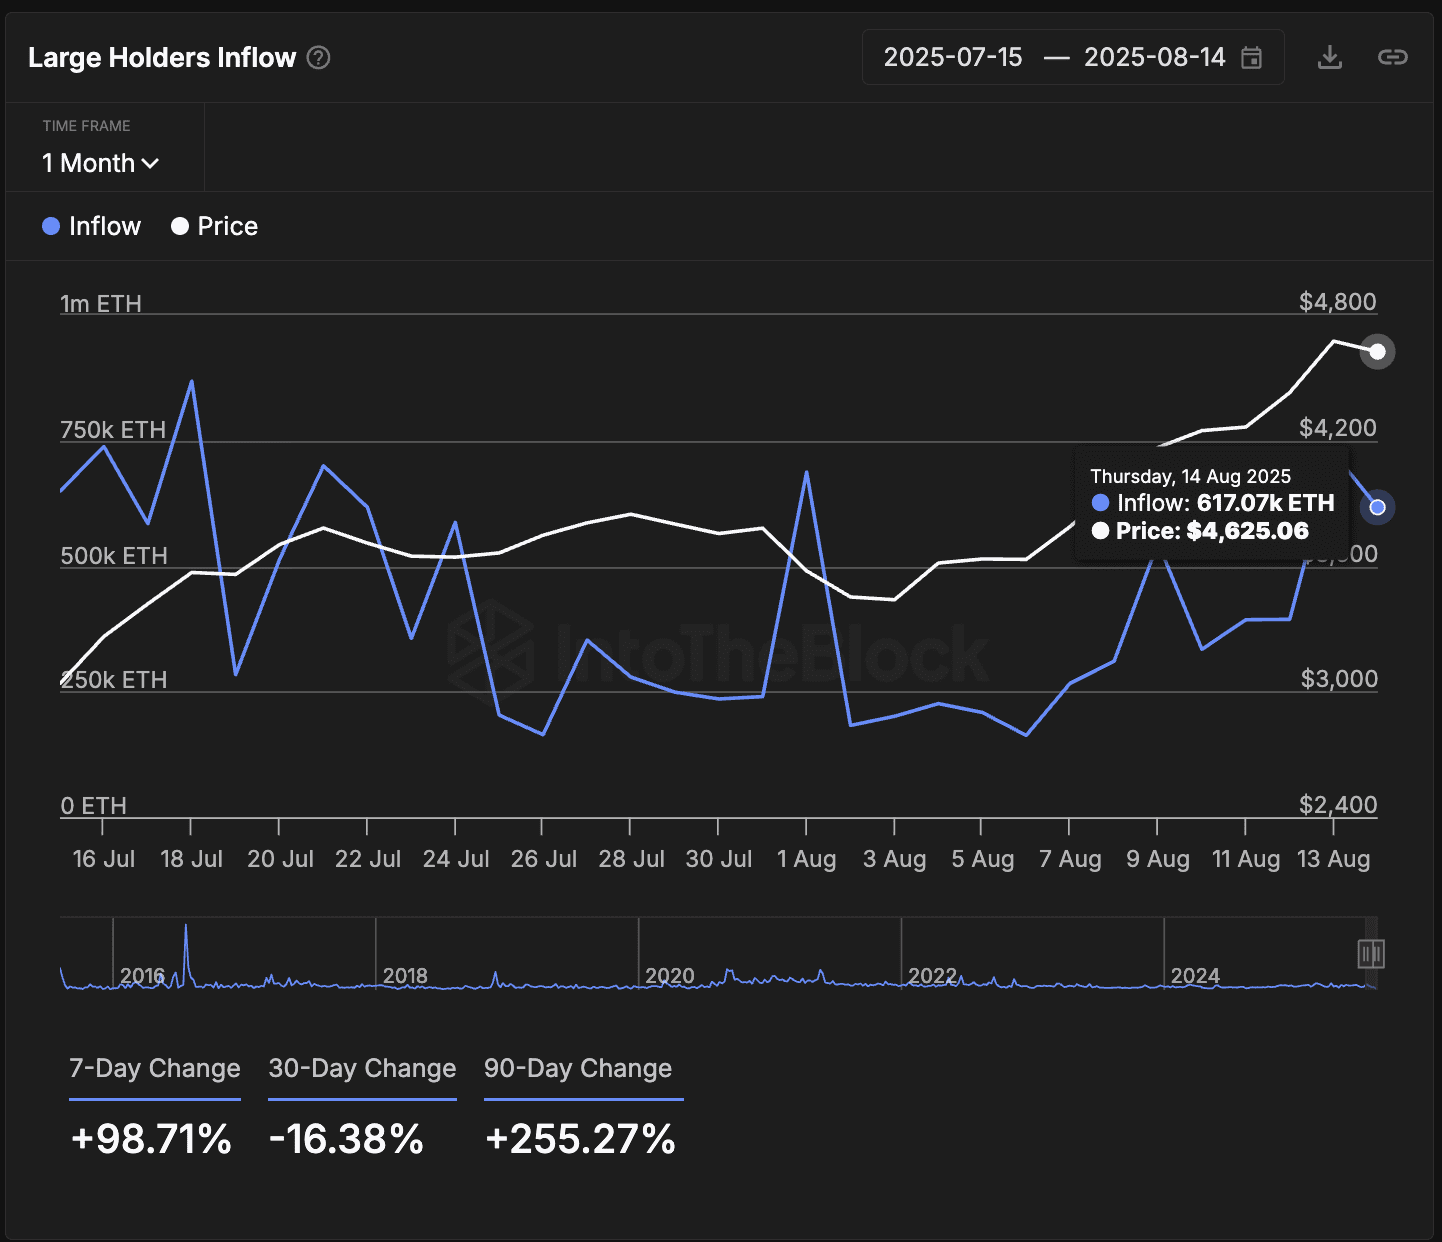 Ethereum price and large investor inflows: IntoTheBlock
For example, between July 31 and August 1, when the price of ETH dropped from $3,781 to $3,577, large investor inflows jumped from 240,190 ETH to 687,290 ETH.
Even after small corrections, these inflows continued to hit monthly highs. The figure reached 725,000 ETH on August 13 before stabilizing at over 617,000 ETH. This is a sign that buyers with significant purchasing power are still building positions.
Inflows to exchanges track coins moving to exchanges, often signaling potential selling. Large investor inflows, on the other hand, measure the amount accumulated by wallets holding at least 0.1% of the supply. It is a measure of buying pressure from large players.
Ethereum's price structure holds while bulls maintain control
Technically, the price of Ethereum remains in an uptrend, with the $4,480 zone acting as strong support during the recent drop. Immediate resistance is at $4,785, a key Fibonacci extension level. A daily close above this could pave the way for the psychological level of $5,000, more precisely $5,175.
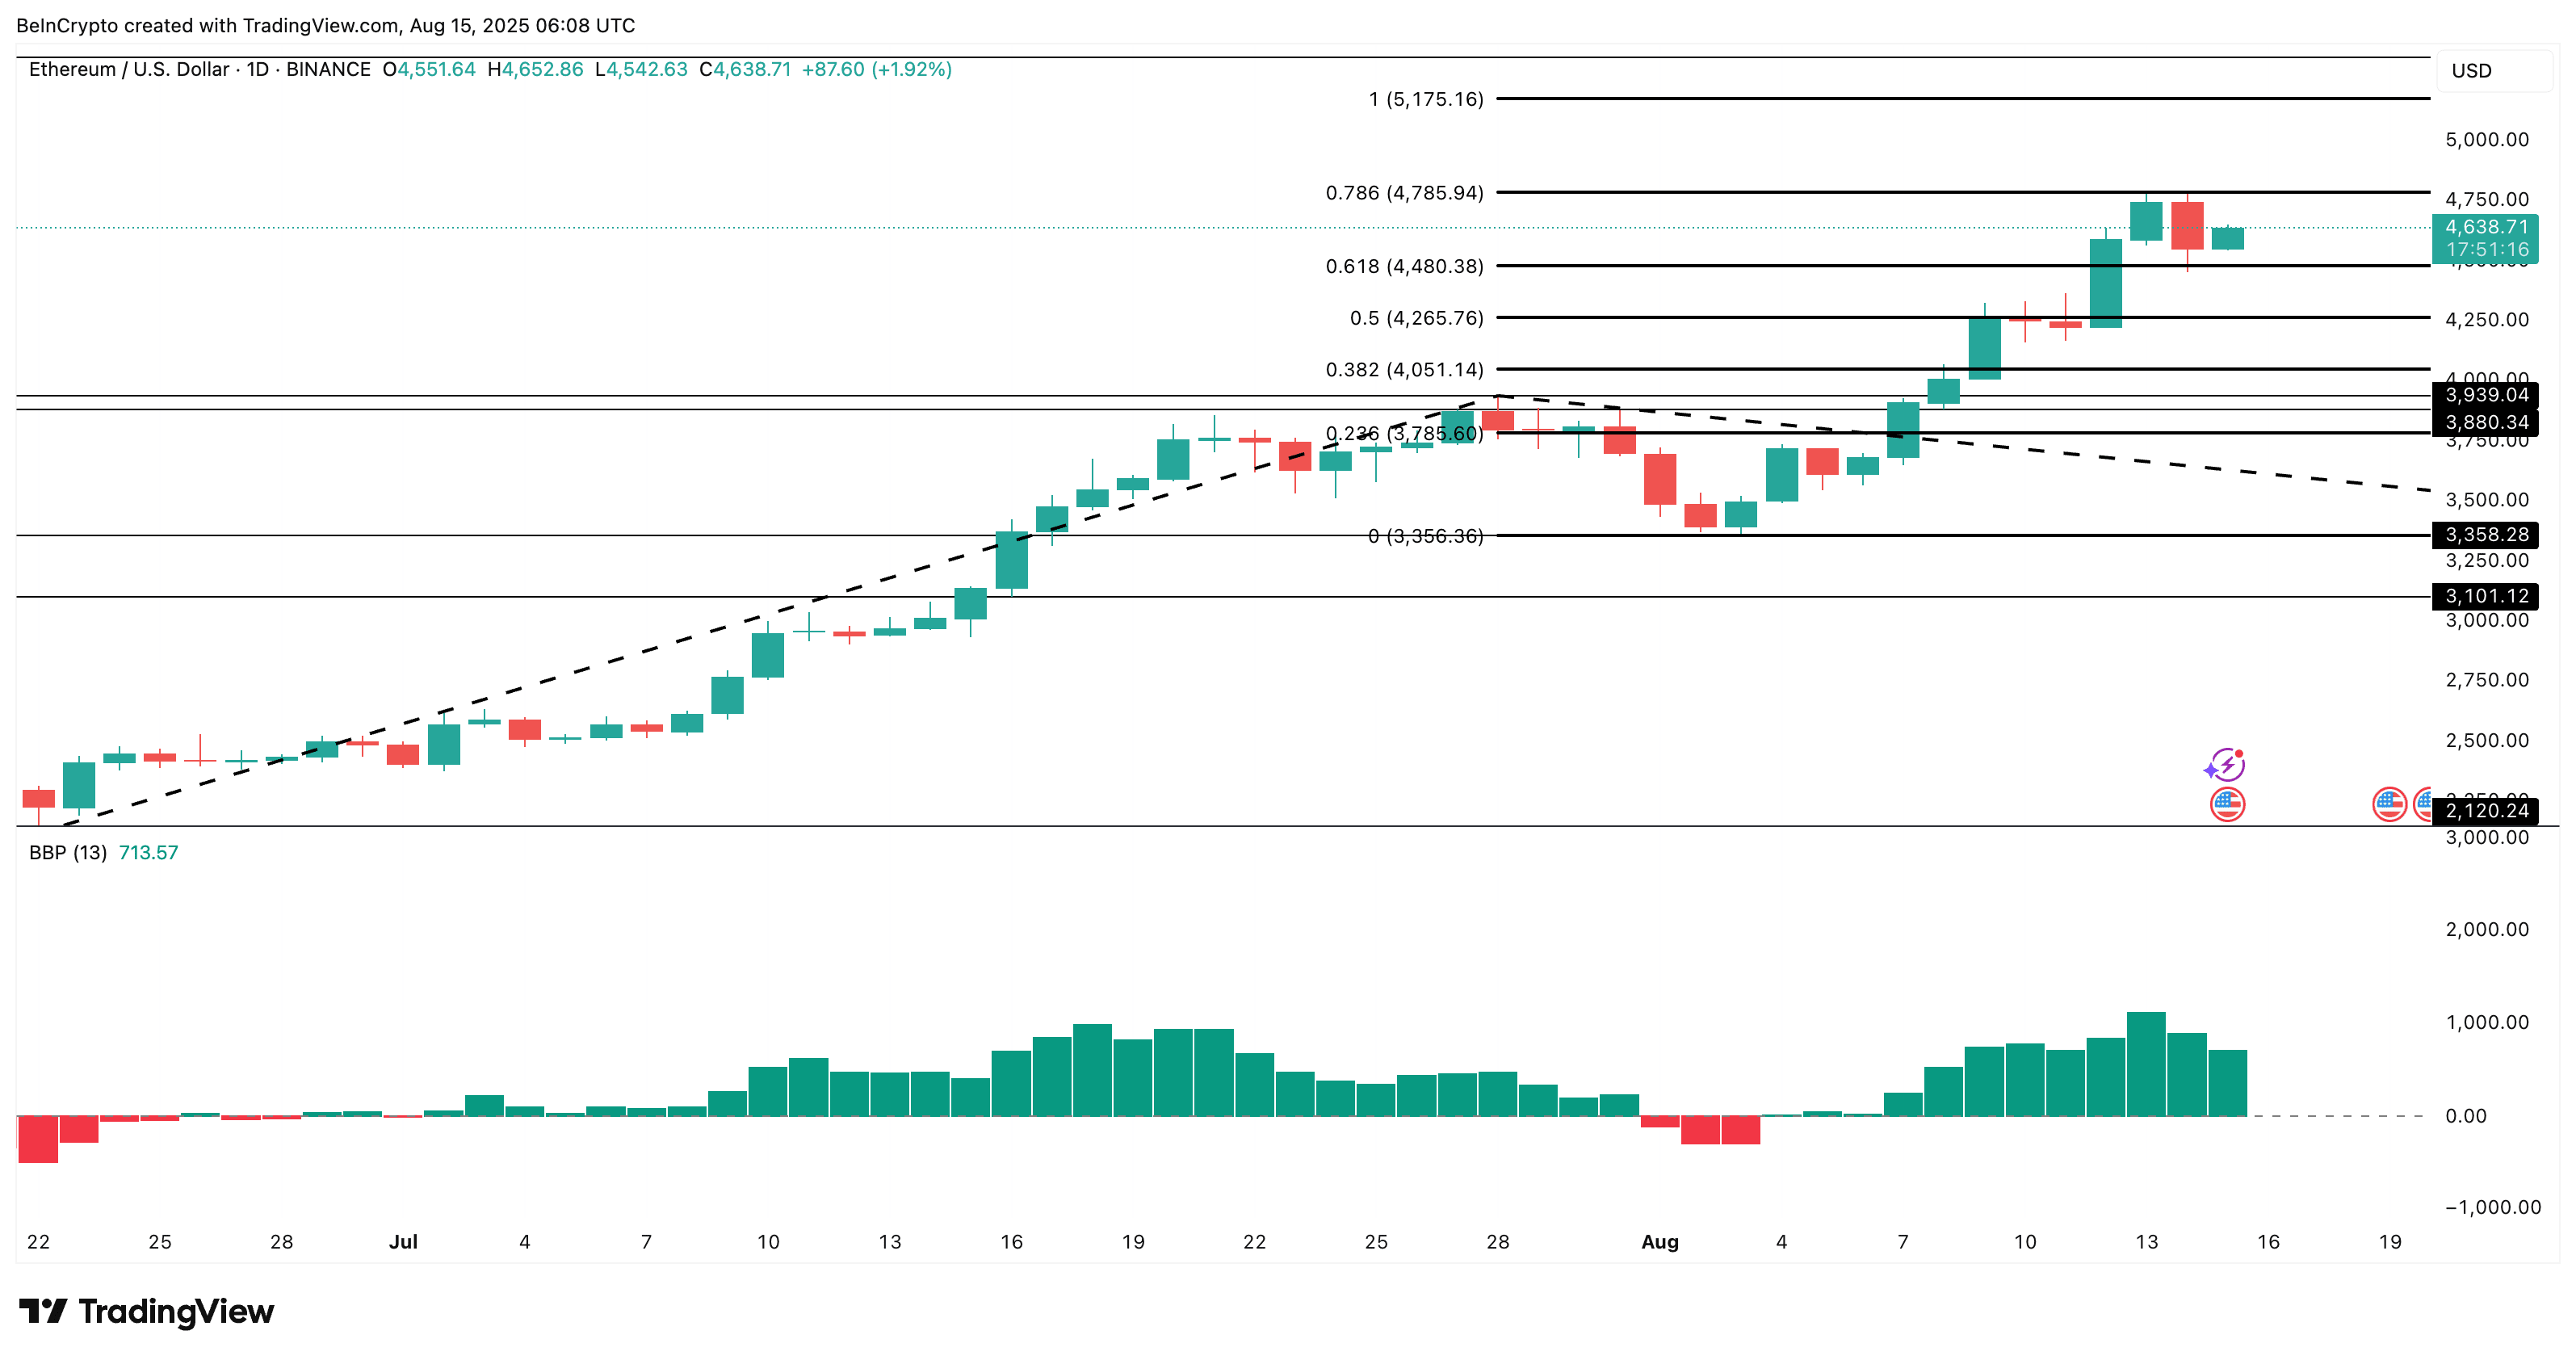 Ethereum price analysis: TradingView
The buy-sell power indicator continues to favor buyers, showing that despite heavy inflows to exchanges, sellers have not taken control.
The invalidation of the bullish hypothesis would require a decisive break (full candle) below $4,480. This should be accompanied by a sustained increase in ETH inflows to exchanges and a drop in large investor inflows over 30 days; conditions that have not yet been met.
The article 'Ethereum Faces Second Largest Sell-off of the Year: Is $5,000 Still Possible?' was first seen on BeInCrypto Brazil.
