
According to a cryptocurrency analyst, the current Bitcoin price chart is beginning to mimic the pattern it exhibited when it reached its previous all-time high of $69,000 in November 2021.
However, some other analysts argue that the charts no longer fully reflect the current market reality, especially as demand for Bitcoin from cryptocurrency asset management companies continues to rise.
The Similarity Between the Current Bitcoin Chart and 2021
Technical analysts often compare Bitcoin price charts with patterns from previous cycles to predict when prices might peak, when to sell, and when money might shift to other assets.
Investor Nebraskangooner shared on platform X on Thursday, accompanied by a chart showing the double top pattern, which is often viewed by investors as a bearish signal indicating a potential reversal in trend.
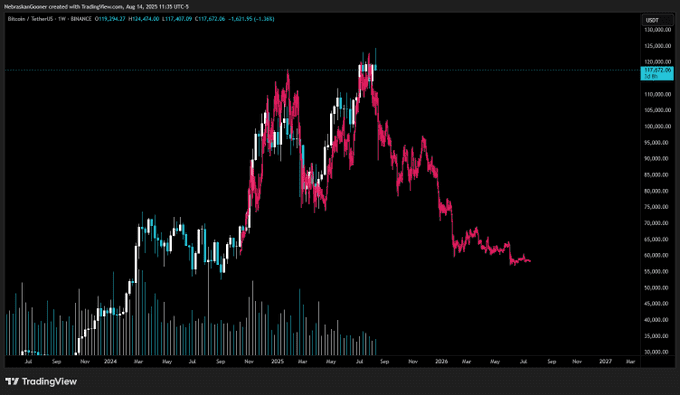
Cryptocurrency analyst Benjamin Cowen also agrees, suggesting that the Bitcoin chart follows the same pattern every year after the halving event.
"Prices will rise in July-August, drop in September, and then rise back to the market cycle peak in Q4. After that, it's a bear market," he said.
Are Investors Fooling Themselves?
However, investor Kale Abe believes Nebraskangooner's observation is just "another example showing that charts and fractals are no longer important."
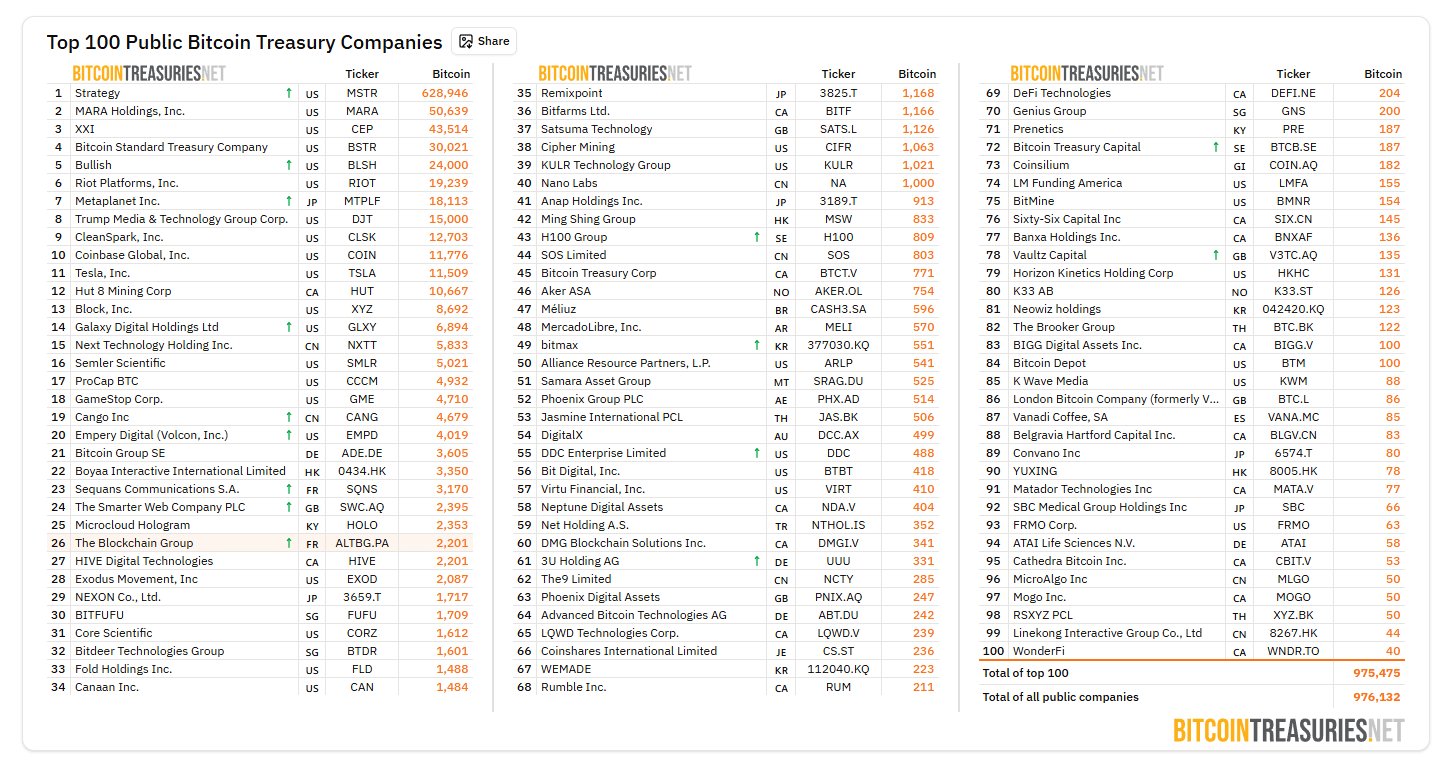
"The only thing that really matters is whether asset management companies still have enough capital," Kale Abe emphasized. Data from BitcoinTreasuries.Net shows that publicly listed asset management companies have purchased a total of $150.98 billion in Bitcoin.
Abe also expressed skepticism about the possibility of Bitcoin "falling into a bear market" as Ether approaches its all-time high. "This is impossible," he asserted. Ether has risen 19% in the past seven days, currently trading at $4,612, about 5.75% below its 2021 all-time high of $4,878.
This comment comes just weeks after veteran investor Peter Brandt stated: "Anyone looking at charts and trying to predict market trends is really just fooling themselves." Brandt believes the true purpose of a price chart is to track where the price has reached and its current position.