
Good afternoon, friends~
Recently, the leading market has been really strong; Bitcoin has reached a new high, and Ethereum is not far from a new high. Have many of you already made a profit? But don't just focus on being happy; we need to carefully analyze the current trend—right now, the main players are using a tactic of one-sided orders. Let's take a look at the trends of Bitcoin and Ethereum together.
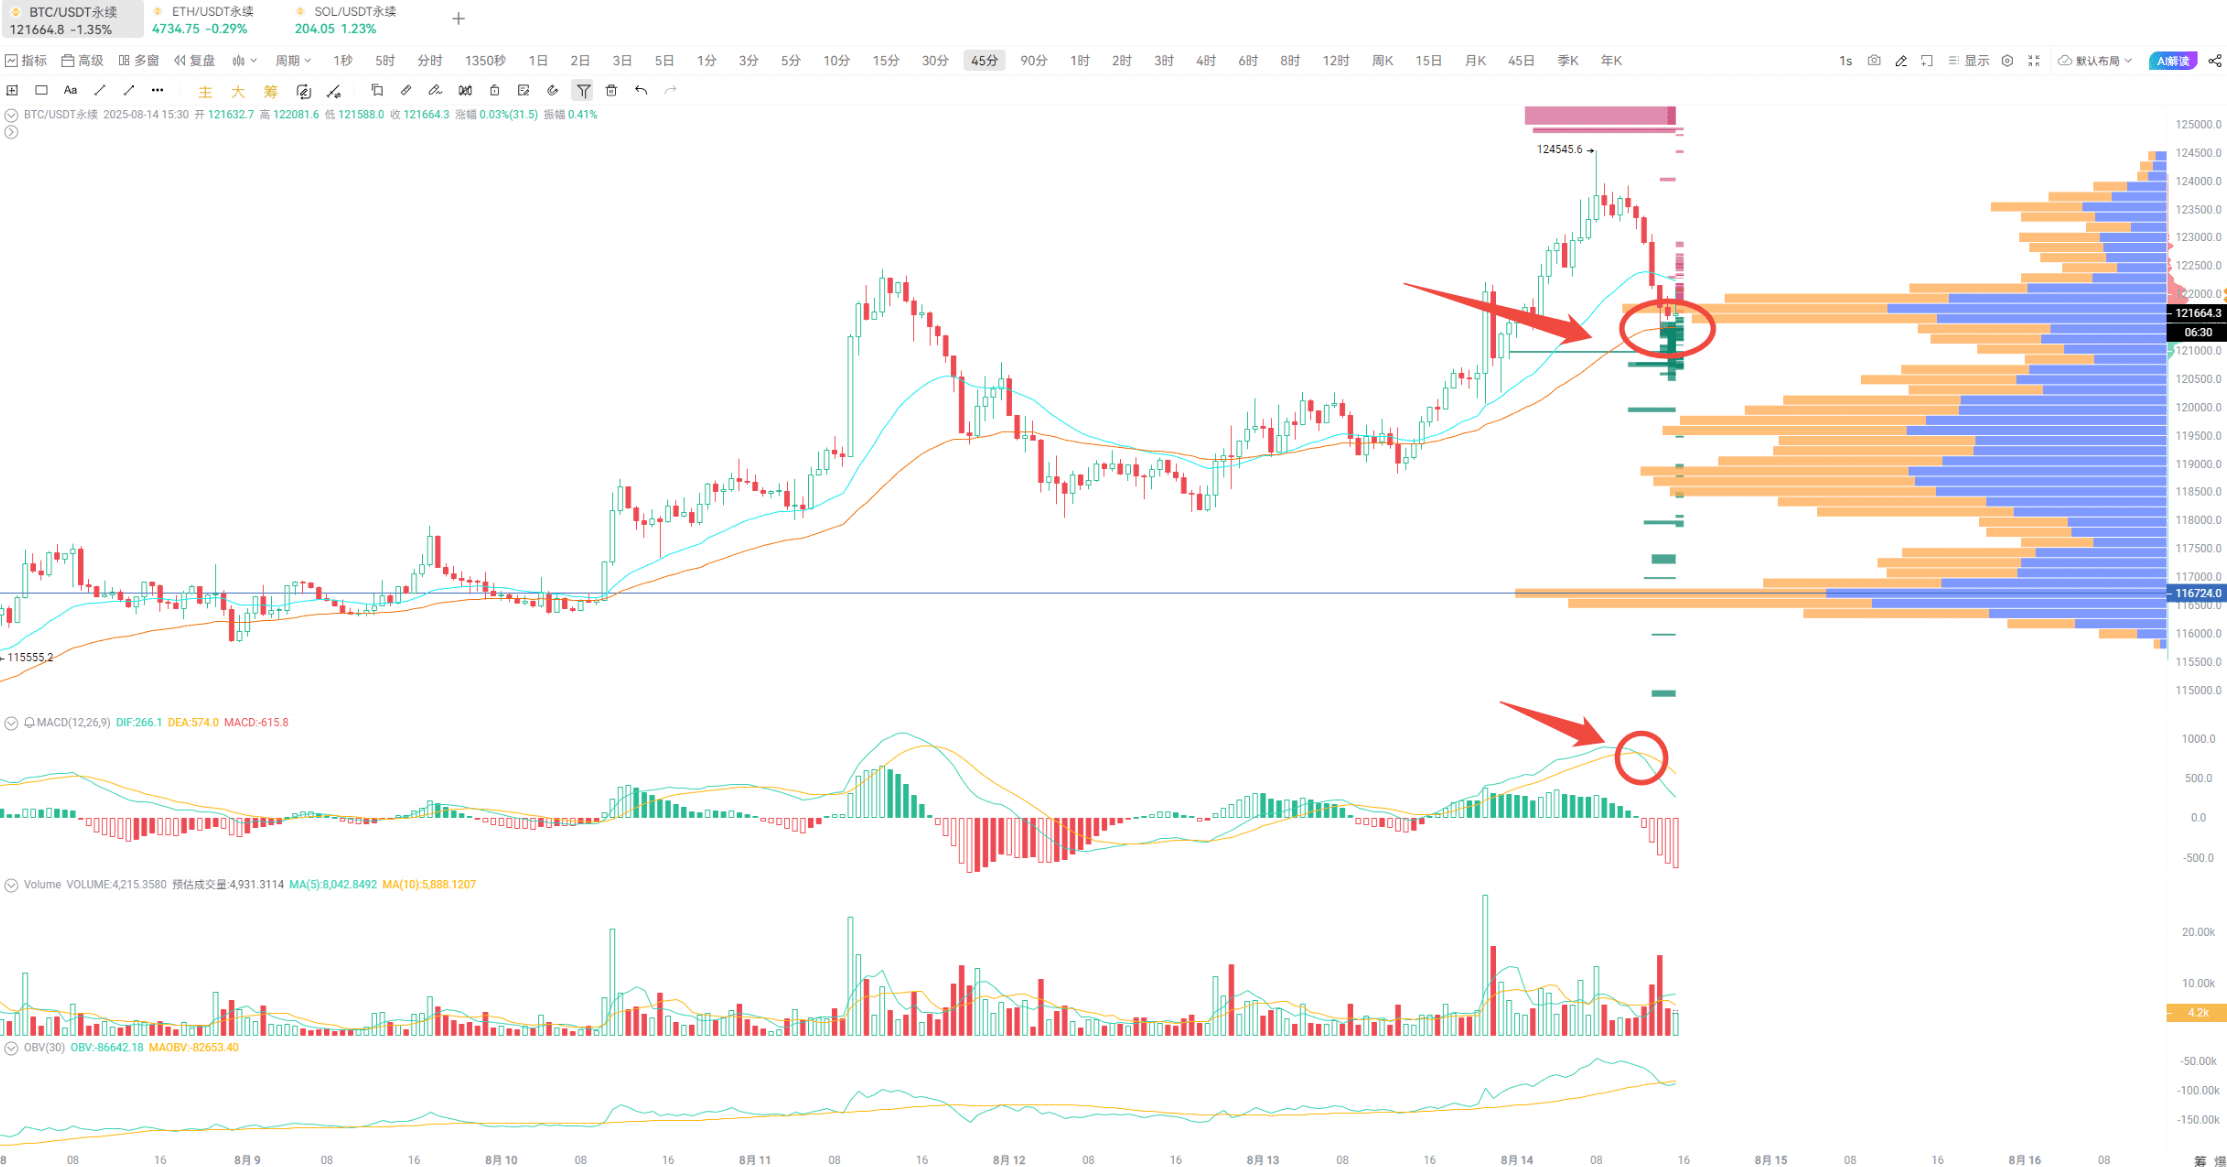
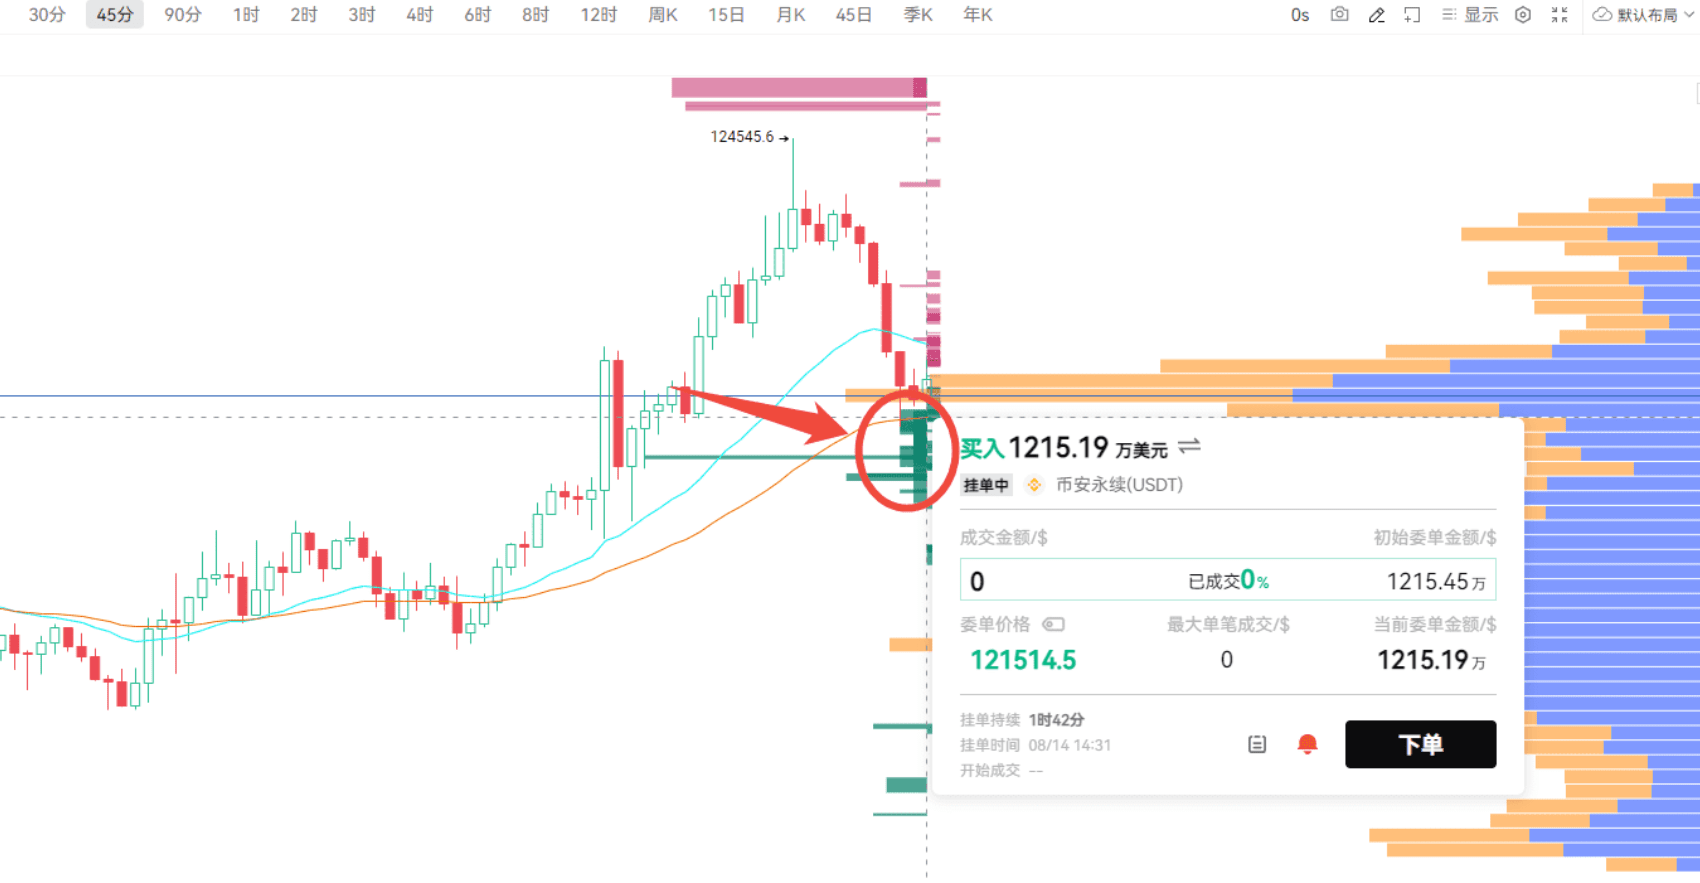
First, let's look at Bitcoin; after forming a short position at a high during the 45-minute cycle, it is now falling back to test the support of the EMA52 moving average. However, large players are clearly betting on the position of 125000, with big holders on Binance and Coinbase positioning themselves here.
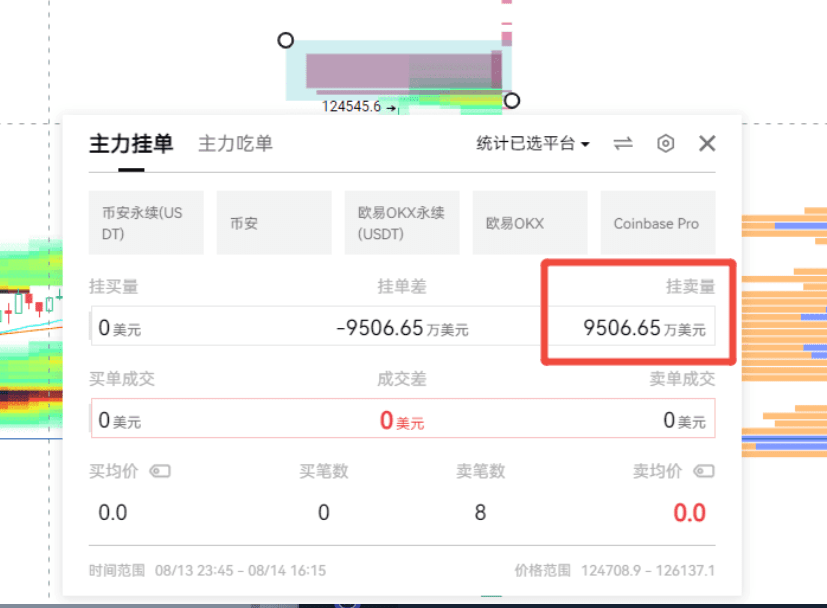
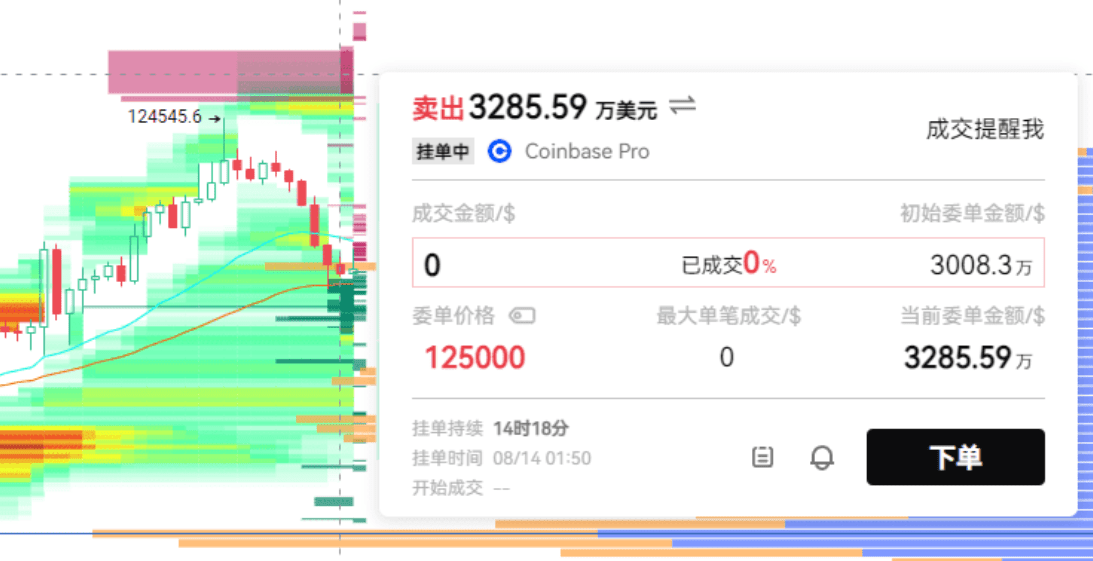
You see, the total sell amount is not small; as long as we can confirm support, it might even push for another new high. If it really falls below at closing time, we need to watch around 120500, which is just near the EMA52 of the 90-minute cycle, and it hides a relatively concentrated liquidation area.
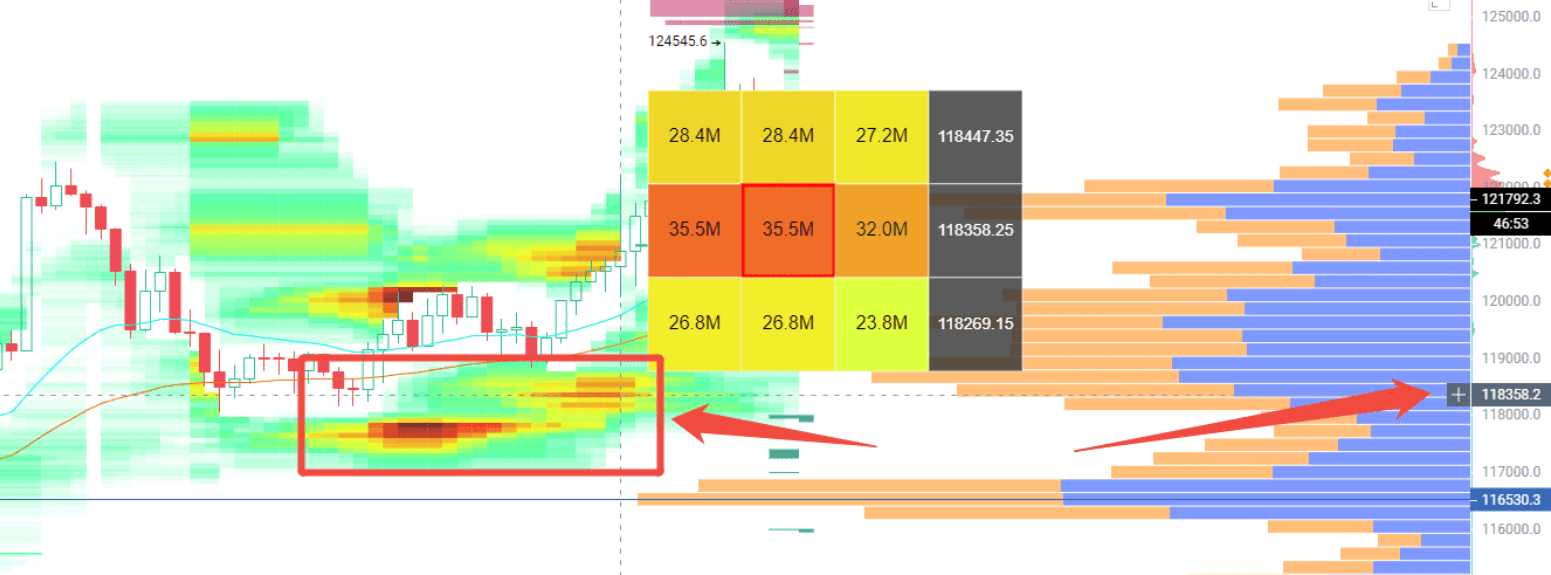
The key lower range is here.
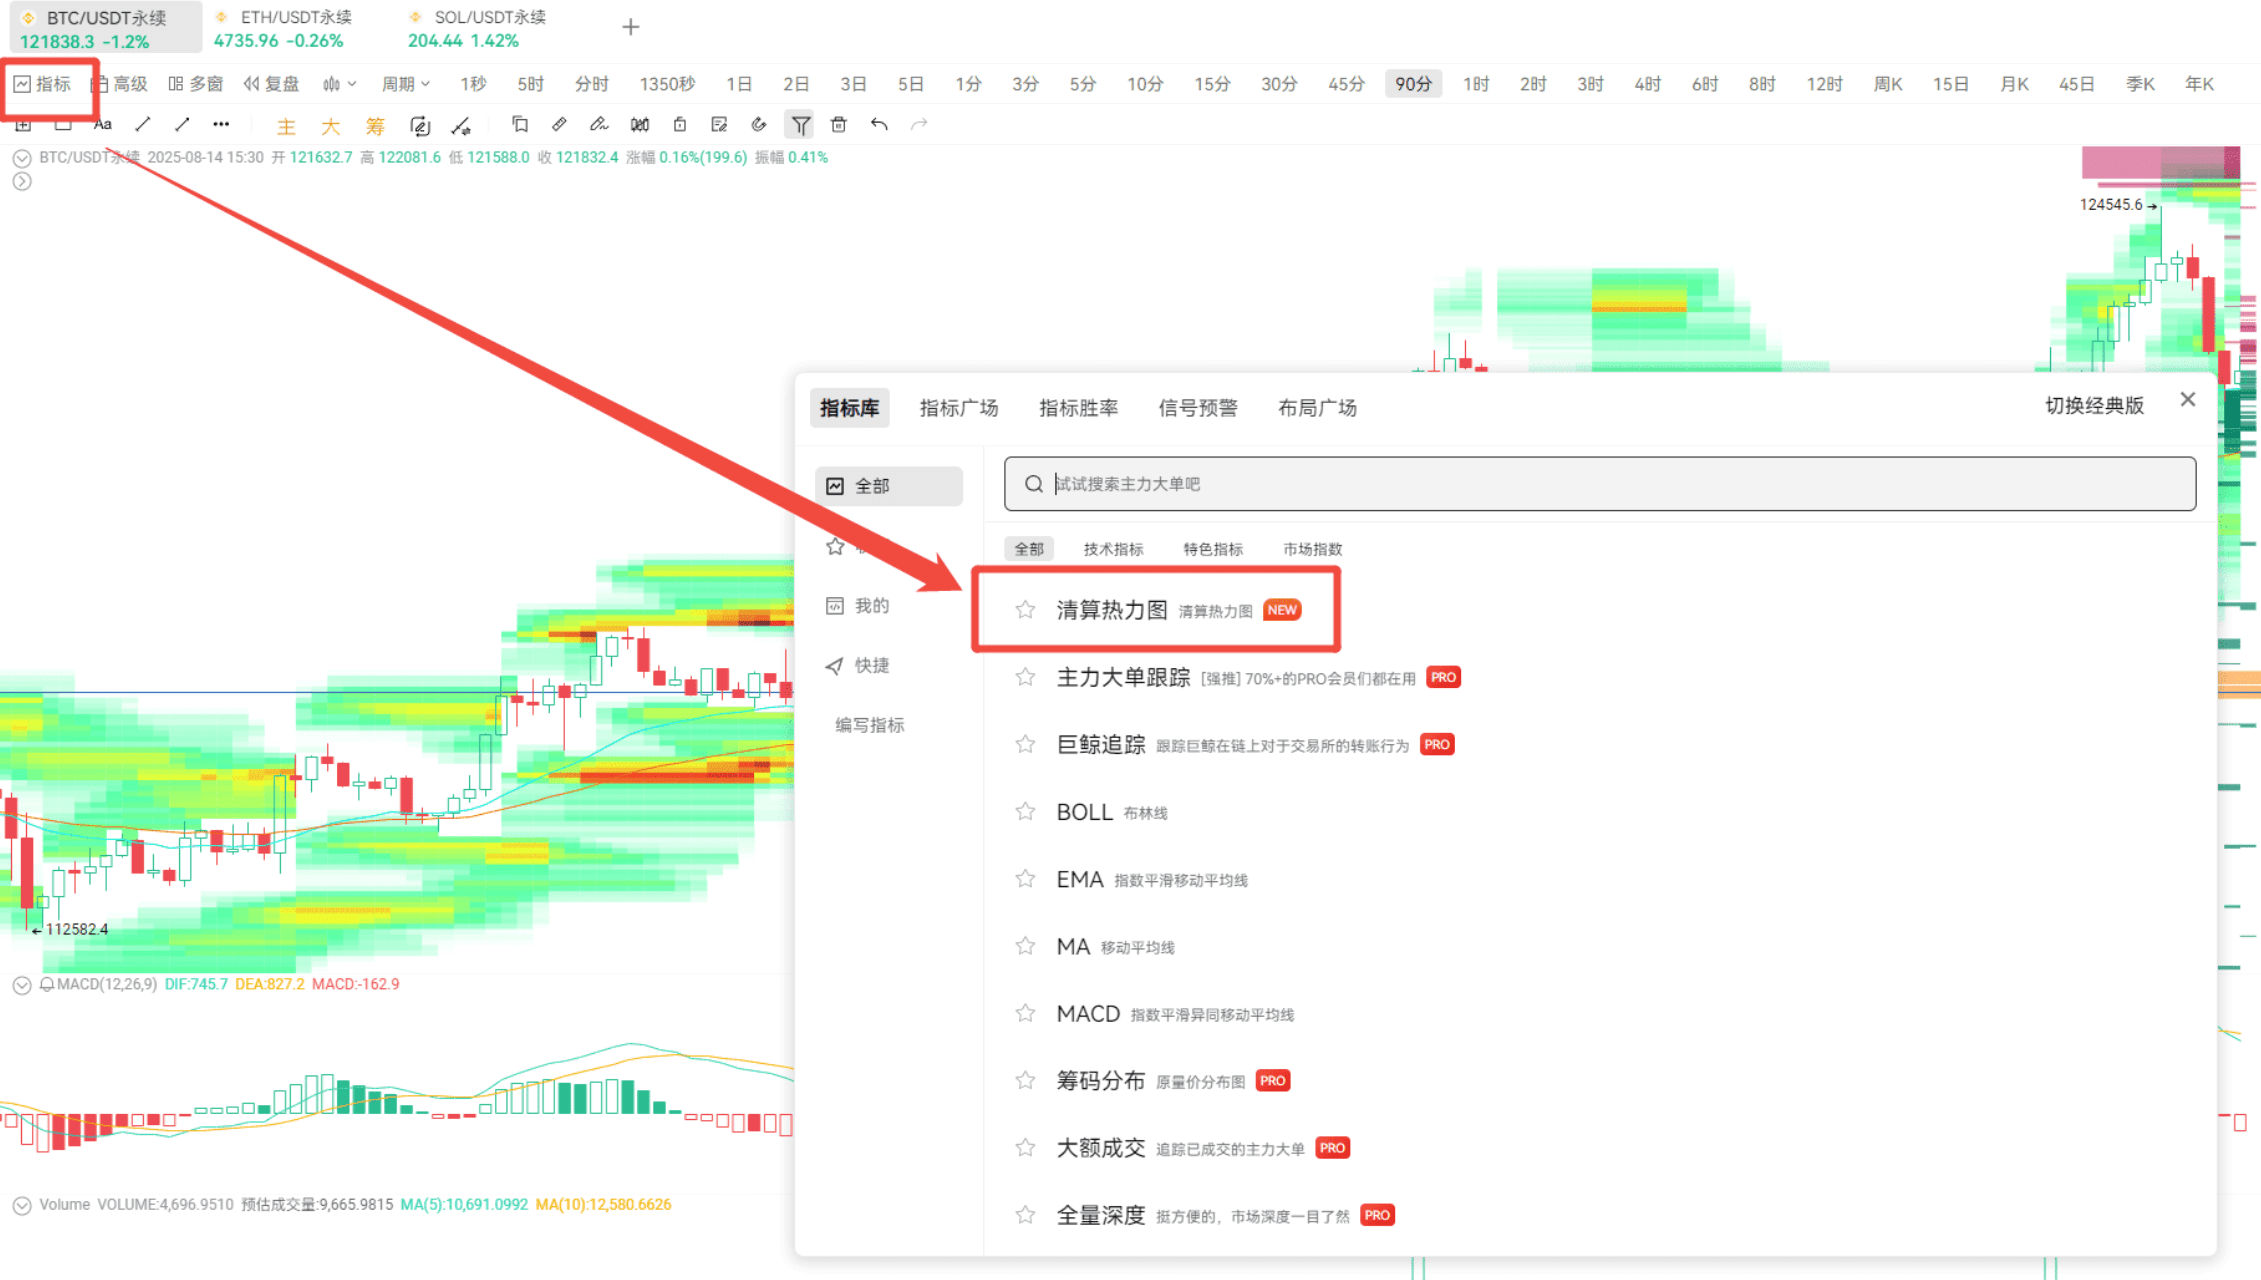
This is pulled from the free liquidation heatmap indicator.
Whether it can stabilize depends on this wave—the moving averages have a lot of buy orders nearby.
I recommend everyone to engage in right-side trading; it's more prudent to wait for closing confirmation before entering the market.
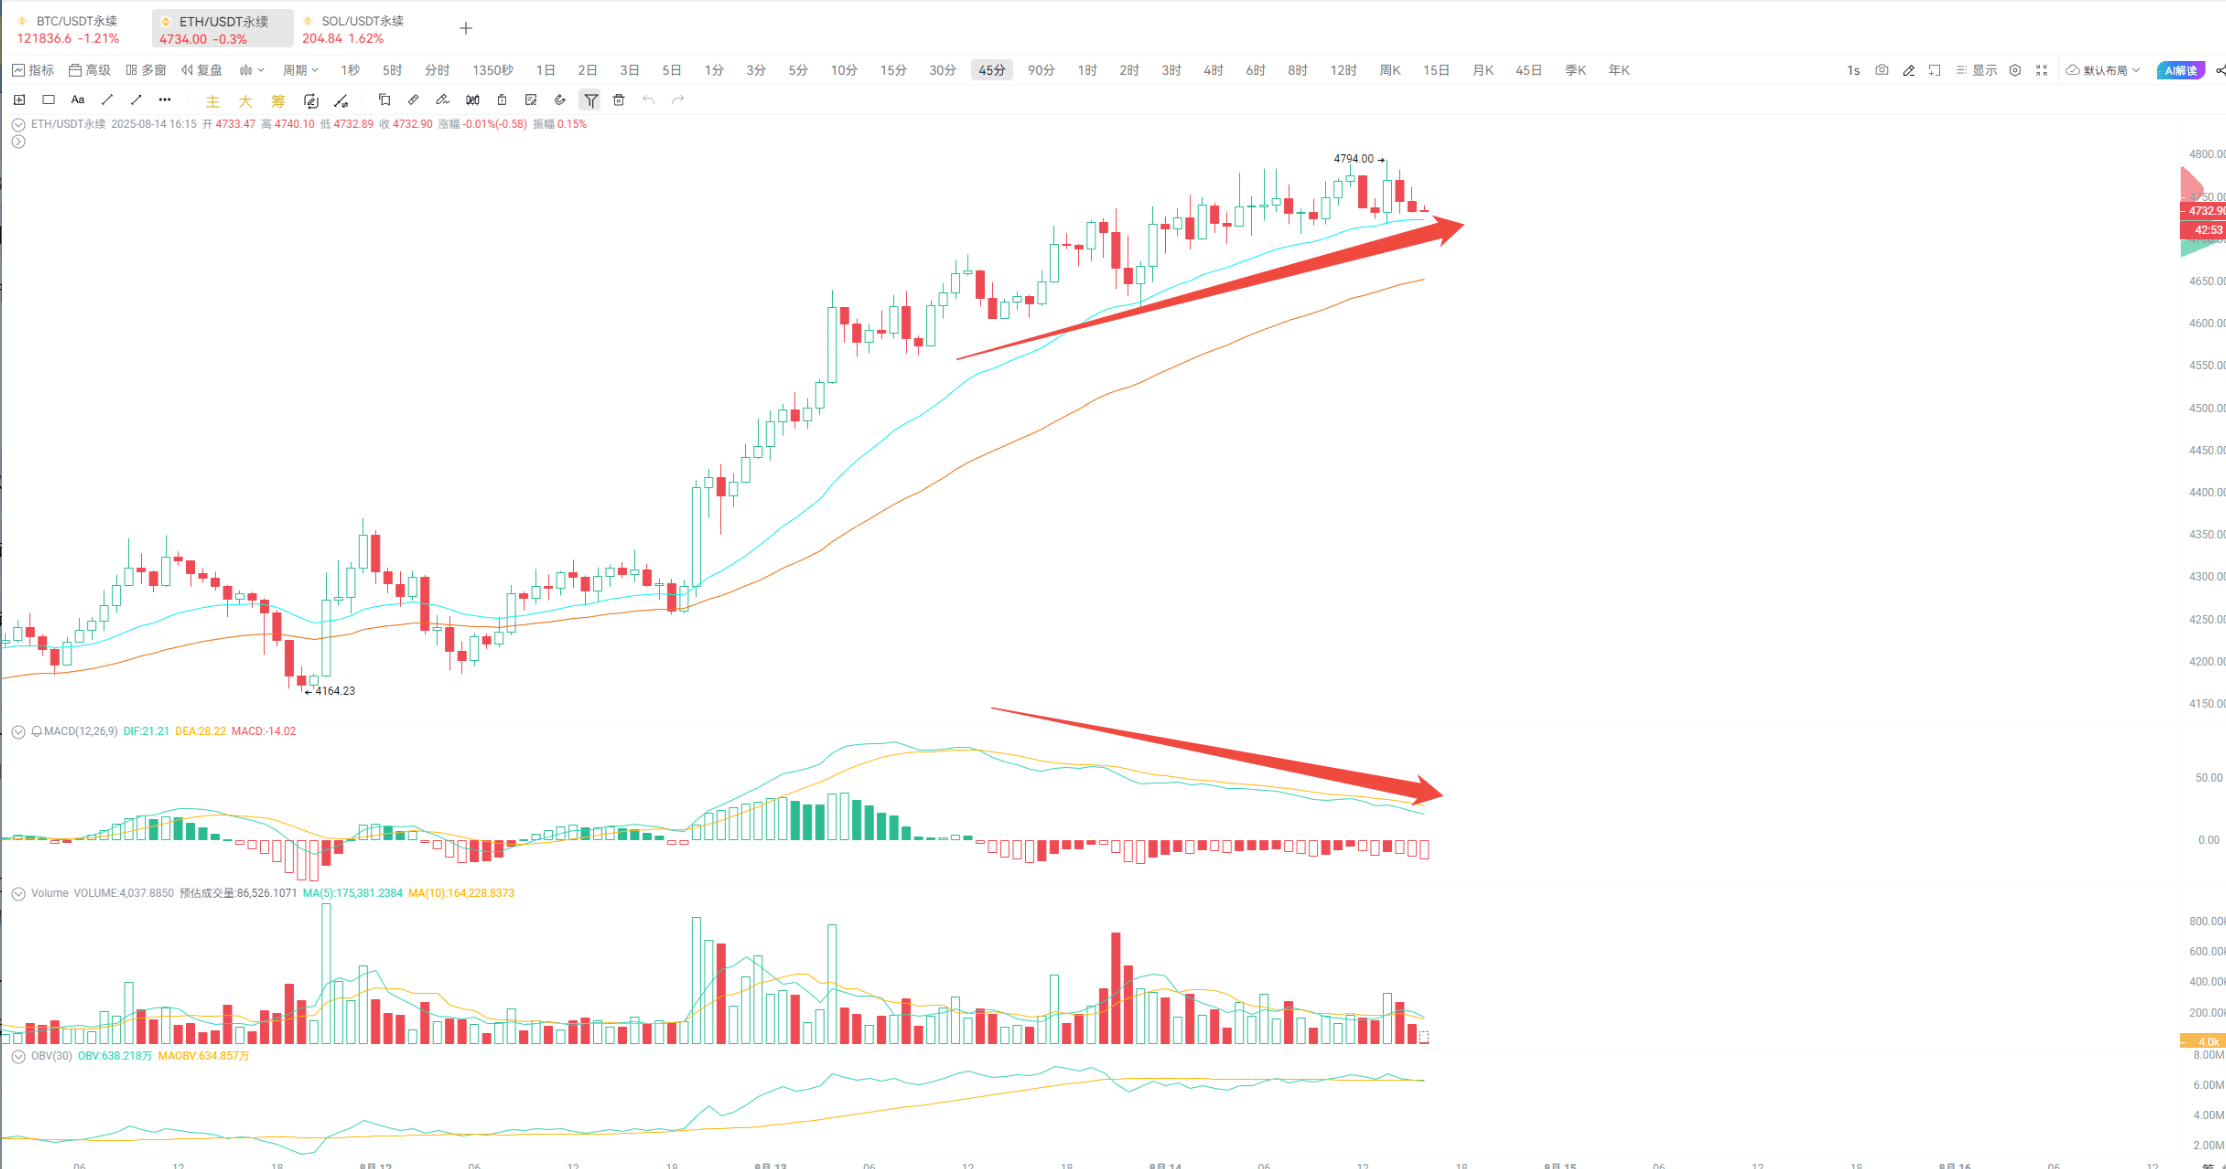
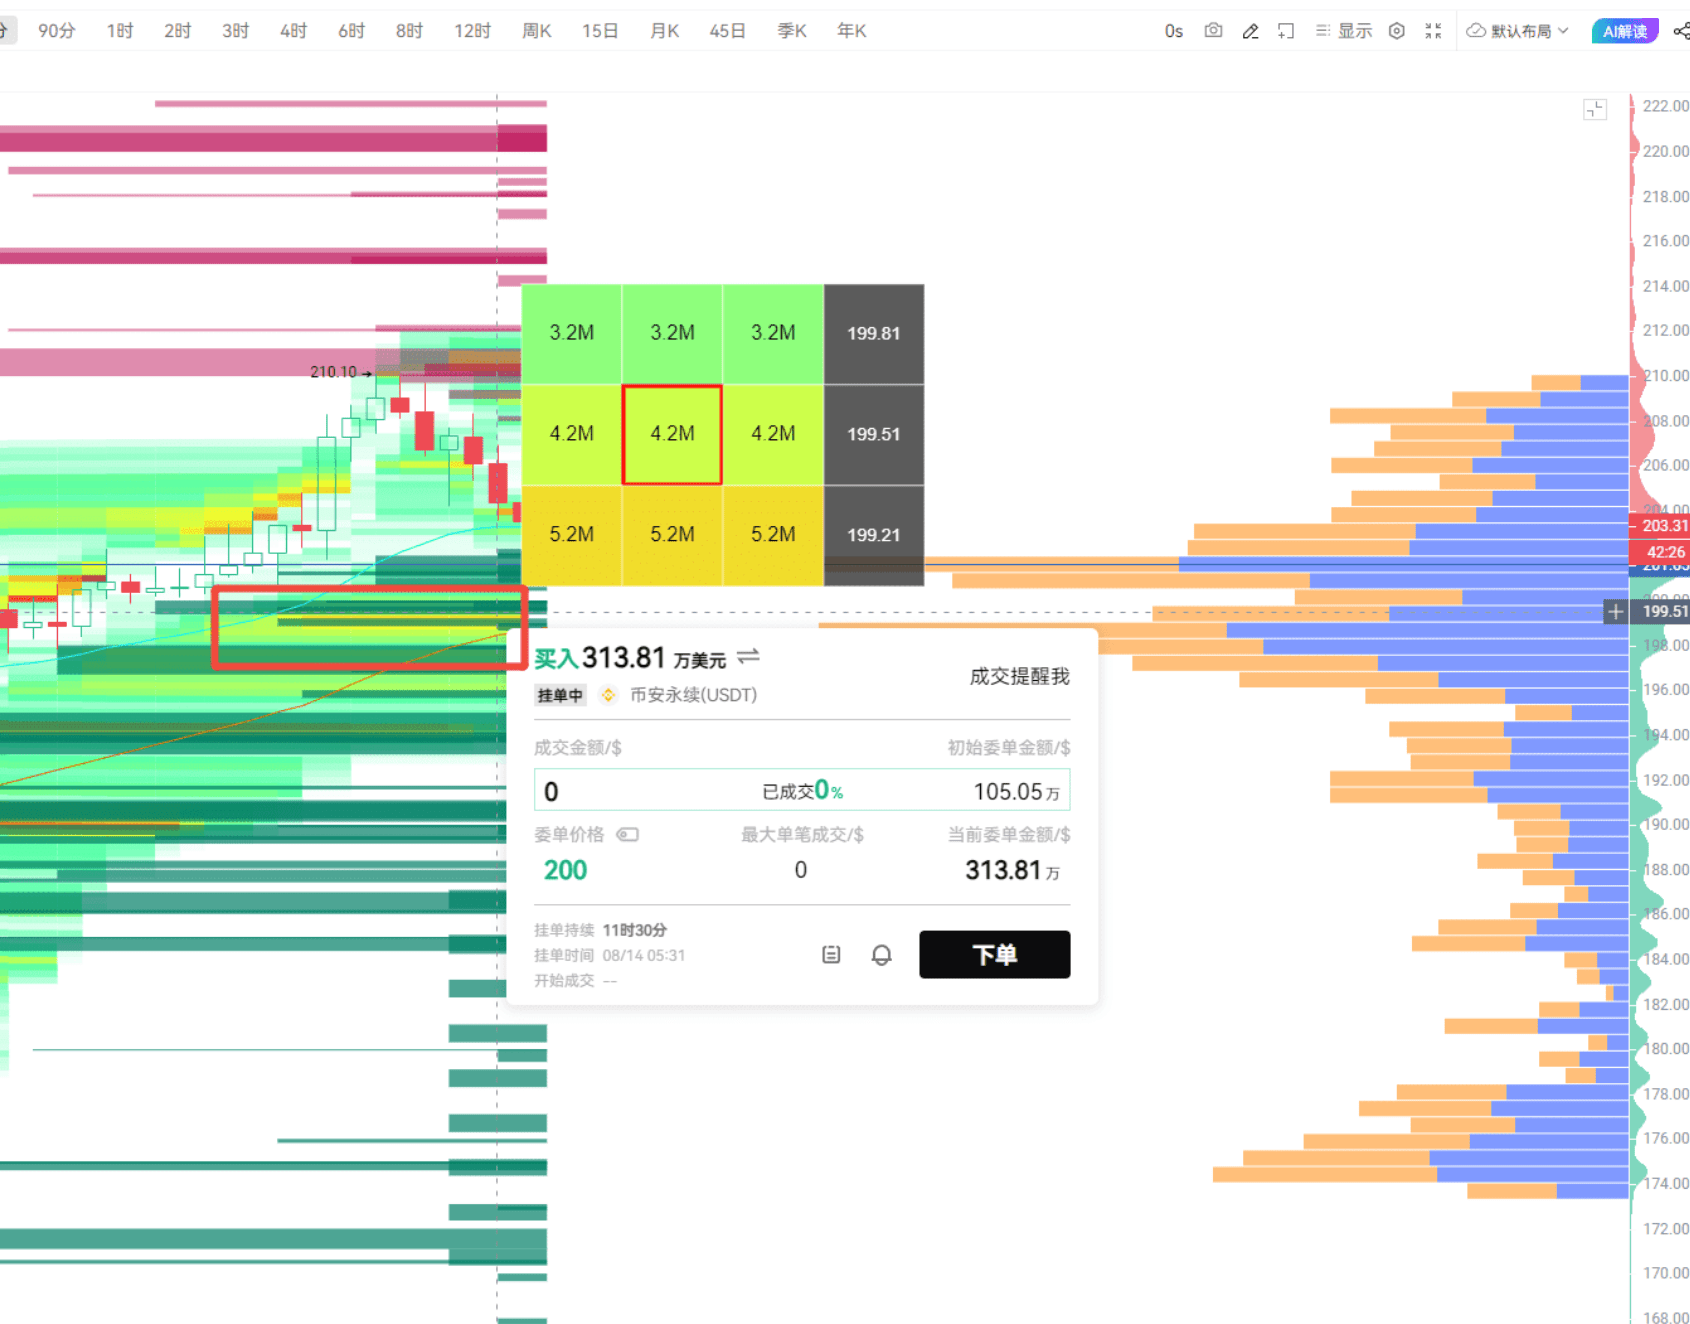
Now let's talk about the main trends in Ethereum; there are currently a lot of sell orders. It's important to note that there are many buy orders stacked between the EMA24 and EMA52 moving averages. Those looking to short should wait until it breaks below the EMA52 before considering, and ultra-short-term traders may want to avoid this.
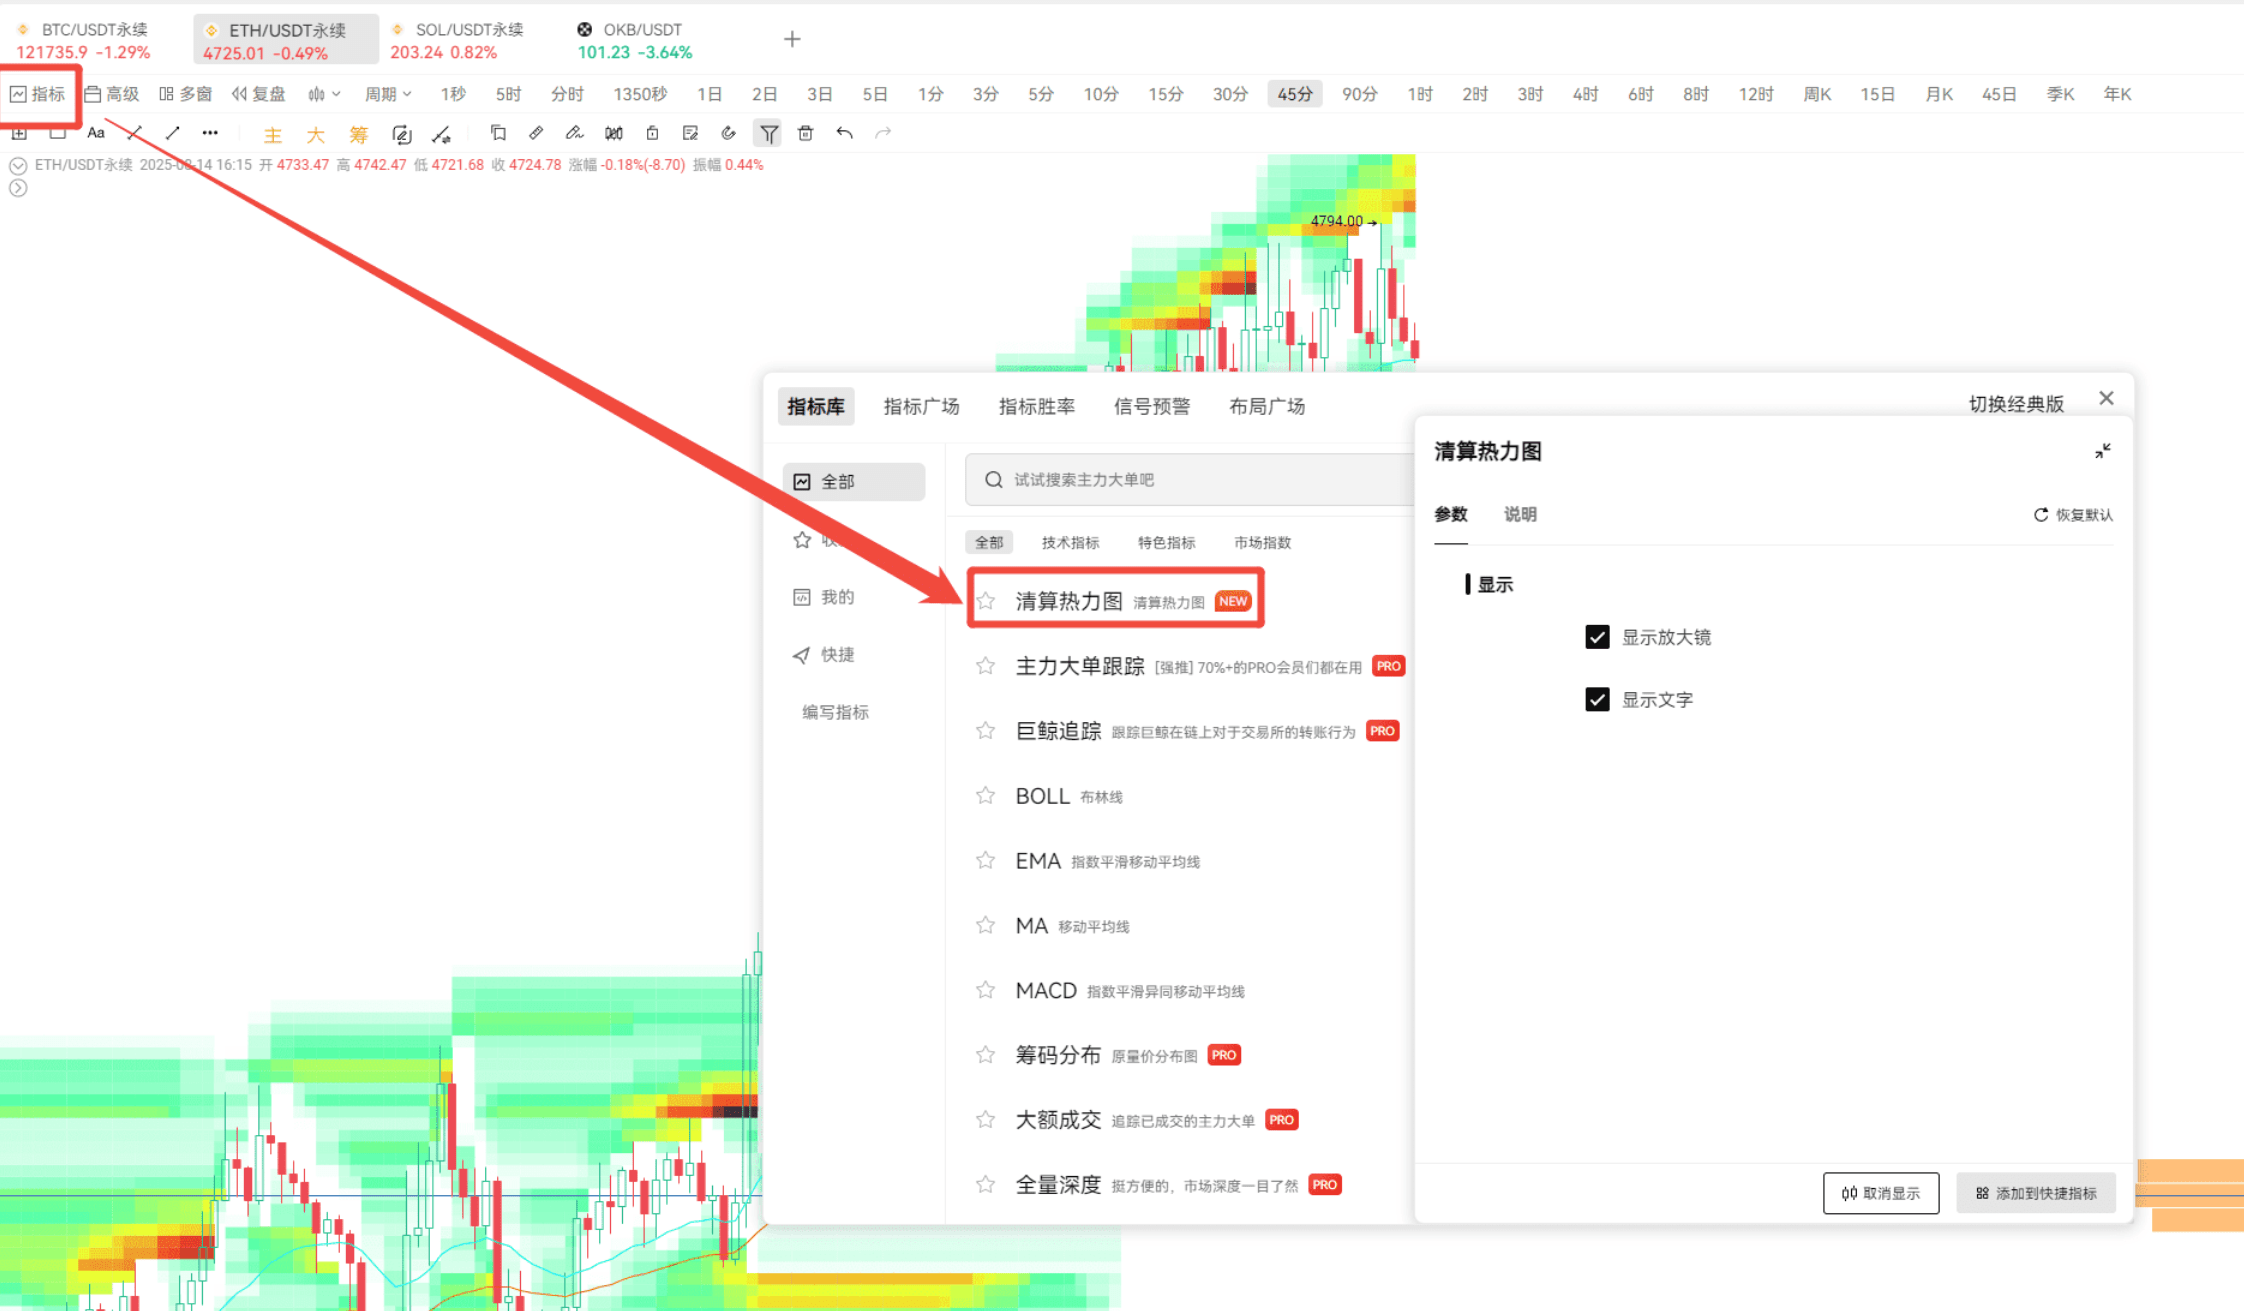
Here comes the key point! I recommend our newly launched liquidation heatmap indicator, which is free and practical! It's those green, yellow, and red blocks in the image (this is a PC-specific indicator). In simple terms, it's a 'liquidation mine distribution map'—the darker the color, the more high-leverage liquidation orders are hidden there. The more concentrated these liquidation orders are, the easier it is for the price to be 'pulled' there, as the main players love to monitor these 'liquidity pools' to harvest leveraged positions.
The usage is actually very simple:
By looking at the 'magnetic areas', you can predict the potential price range. The so-called magnetic area is the darker regions; for example, this one happens to fall between the EMA24 and EMA52 moving averages, and this area also has a dense stack of buy orders, so short-term traders can focus on this.
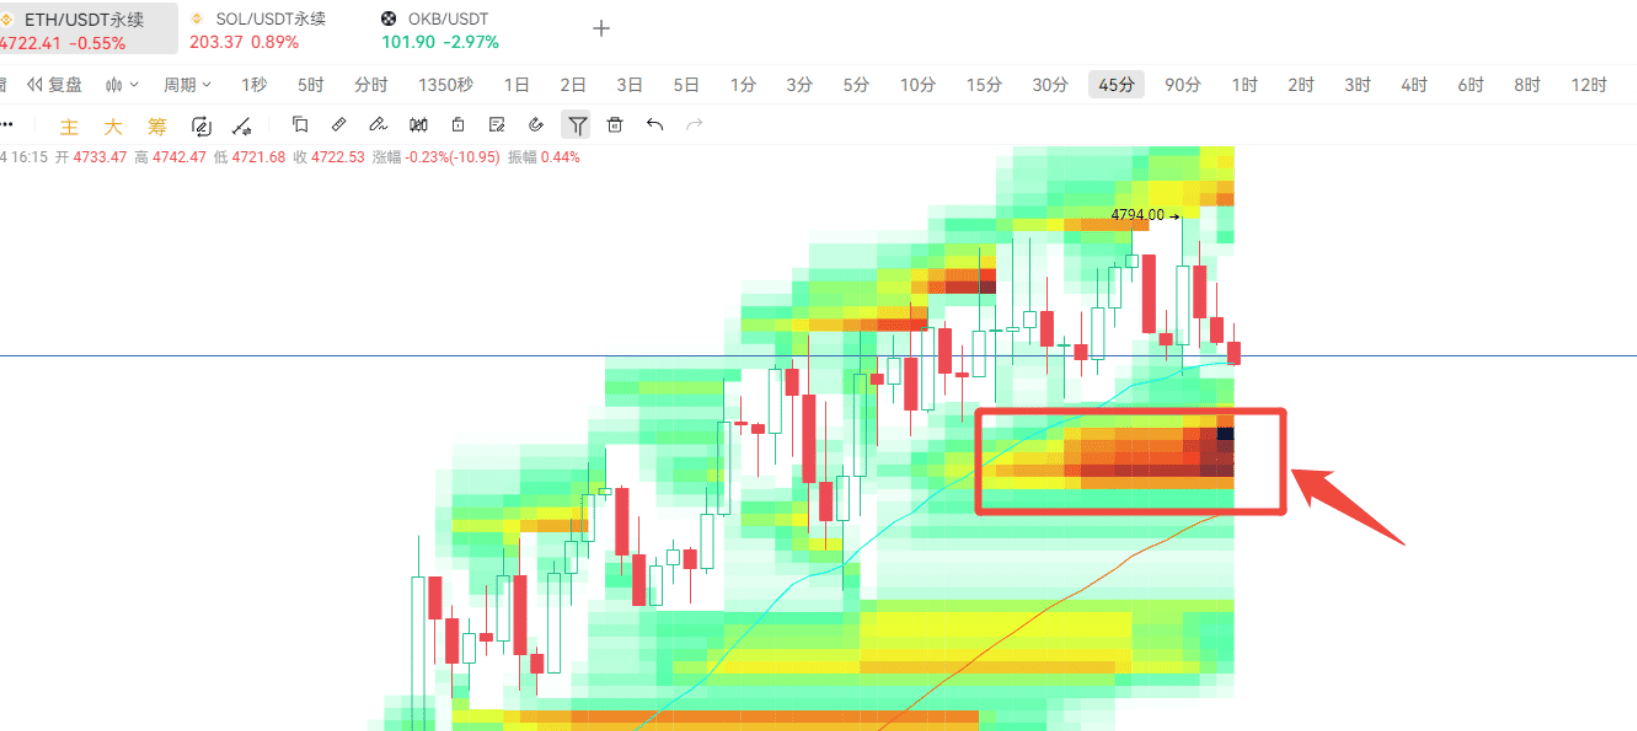
Areas with a large concentration of liquidation orders will attract prices like a magnet, just like the gravitational effect of large orders. Hovering the mouse over it will reveal specific prices and estimated liquidation volumes.
If it can stabilize, Ethereum might just hit 4800. If the liquidation position is close to the current price and happens to be near large orders, that's double the gravitational pull; following the corresponding range for short-term trading is definitely a good idea.
This article only represents the author's personal views and does not represent the stance and views of this platform. This article is for informational sharing only and does not constitute any investment advice to anyone.