
Written by: White55, Mars Finance
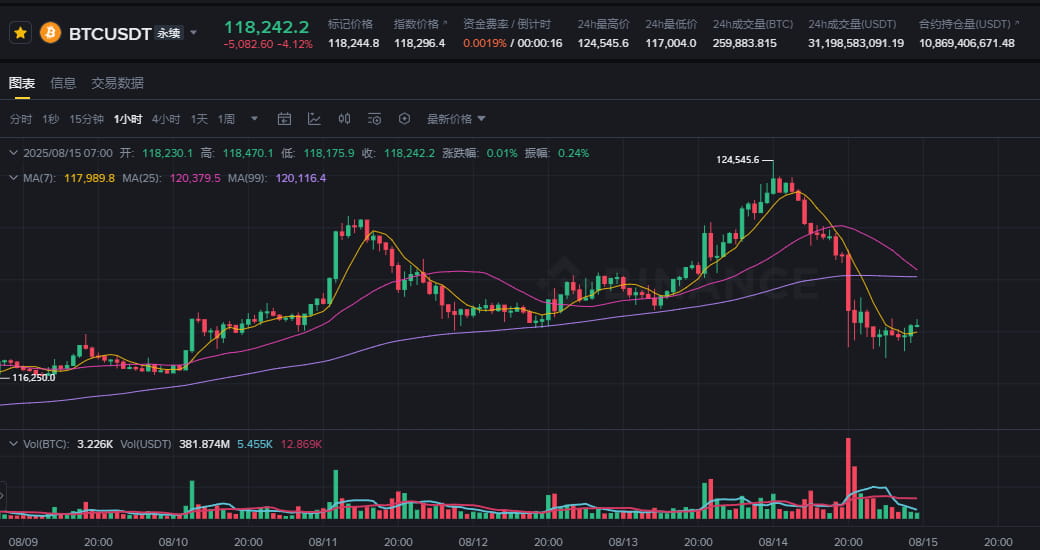
The Bitcoin market staged a shocking scene on August 15. Just hours after hitting a historical high of $124,500, the price of Bitcoin suddenly turned downwards, rapidly breaking the key support level of $117,500, with an intraday drop of 4.24%, reaching a low of $117,000. This plunge of up to $7,000 was like a bucket of cold water, dousing the feverish sentiment that had just ignited in the market.
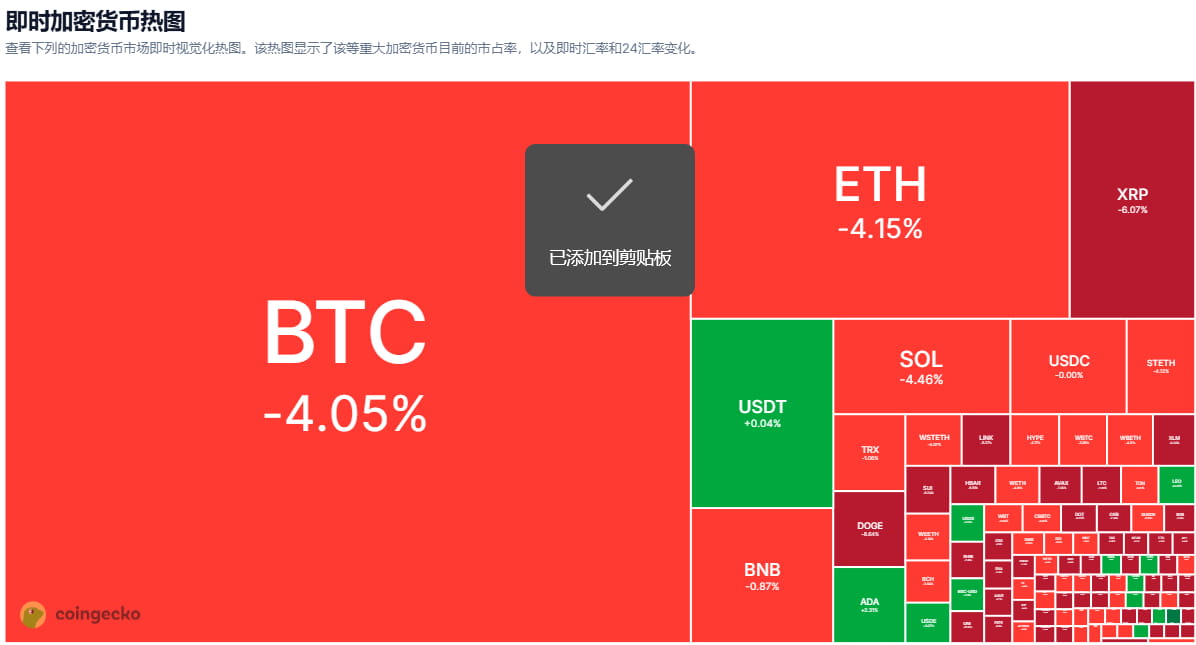
This flash crash was not an isolated event. The total market value of the crypto market evaporated by 3.9% in 24 hours, falling to $4.09 trillion. Ethereum followed Bitcoin and fell simultaneously, breaking the $4,500 mark and is now trading at $4,568.
Even more tragic was the altcoin market, with Ethereum ecosystem tokens such as REZ, SSV, and ORDI generally plummeting by more than 15%, forming a comprehensive rout.
The Return of the Inflation Ghost: The Fatal Reversal of Macro Data

The unexpected face-changing of U.S. inflation data became the direct trigger for this round of plunge. The Producer Price Index (PPI) for July, released on August 14, soared by 3.3% year-on-year, far exceeding the market expectation of 2.5% and the previous value of 2.3%, marking the largest monthly increase since June 2022. This is in stark contrast to the 'moderate' CPI data released three days ago -- at that time, the overall CPI for July fell back to 2.9%, and the core CPI fell to 3.2% for the fourth consecutive month, which made the market full of expectations for the Fed to cut interest rates.
Deep Anxiety About Inflation Stickiness
Traders' violent reaction to PPI data stems from its leading indication of business costs and consumer prices. Higher producer prices will eventually be passed on to the consumer end, forcing companies to raise prices to maintain profit margins, forming an inflation spiral. This signal quickly changed interest rate expectations: The CME FedWatch tool shows that although the market still expects a 90.5% probability of a rate cut in September, the probability of the rate falling below 3.75% in January 2026 has fallen from 67% a week ago to 61%. The possibility of the Fed postponing easing policies instantly took away the upward momentum of risk assets.
Warning Signals of Stock-Coin Divergence
Ironically, traditional stock markets rebounded quickly after digesting PPI data, with the S&P 500 hitting record closing highs for the third consecutive day, while Bitcoin was mired in a sell-off alone. This divergence of risk assets reveals the fragility of the cryptocurrency market -- when subtle shifts in liquidity expectations occur, crypto assets are often the first to be cashed out.
Policy Expectations Fail: The Dream of National Bitcoin Reserves Shattered
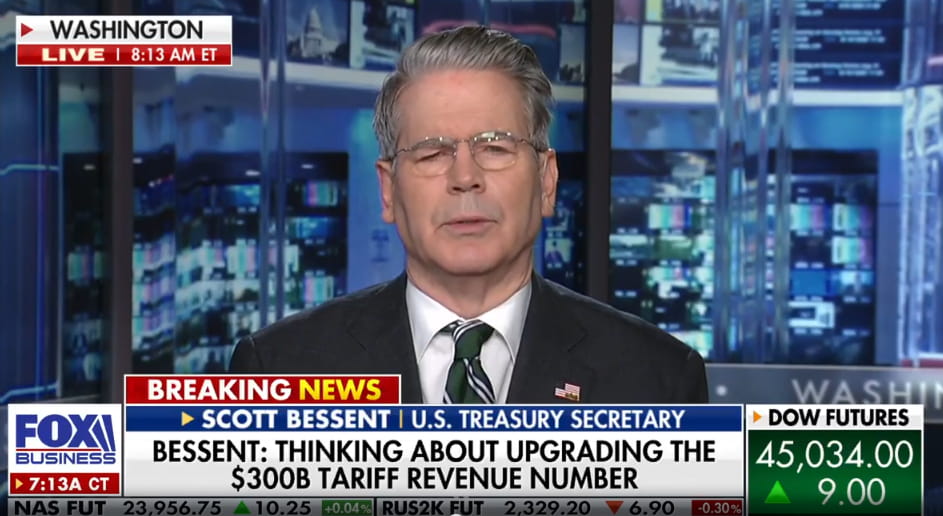 Interview with Scott Bessent. Source: Foxbusiness.com
Just as the Bitcoin community was still looking forward to the U.S. government incorporating it into its strategic reserves, Treasury Secretary Scott Bessent poured cold water on it. In an interview with Fox Business News, he made it clear that: 'The government has no plans to expand Bitcoin strategic reserves,' and categorically denied the possibility of allocating the revaluation income of national debt gold to Bitcoin.
The Expected Difference of Trump's Executive Order
This statement formed a huge gap with market expectations. Trump's executive order signed in March had clearly mentioned a 'budget-neutral strategy to buy more Bitcoin,' igniting institutional investors' imagination of sovereign funds entering the market. Bessent's remarks not only shattered this expectation, but also exposed the differences in policy execution. When the 'digital gold' narrative encountered the lack of sovereign credit endorsement, it became inevitable for speculative funds to withdraw quickly.
The Chain Reaction of Regulatory Cold Wave
Negative policy news formed a domino effect. Although the U.S. SEC withdrew its lawsuit against some crypto projects, key legislation such as the (GENIUS Act) is still being pushed forward, and the ambiguity of the regulatory framework remains like a sword of Damocles hanging high. In addition, discussions on sovereign Bitcoin reserves in countries such as Germany and Japan are still on paper, and institutional funds in the regulatory vacuum are always afraid to enter the market on a large scale.
Technical Collapse: Double Top Looming and Leverage Massacre
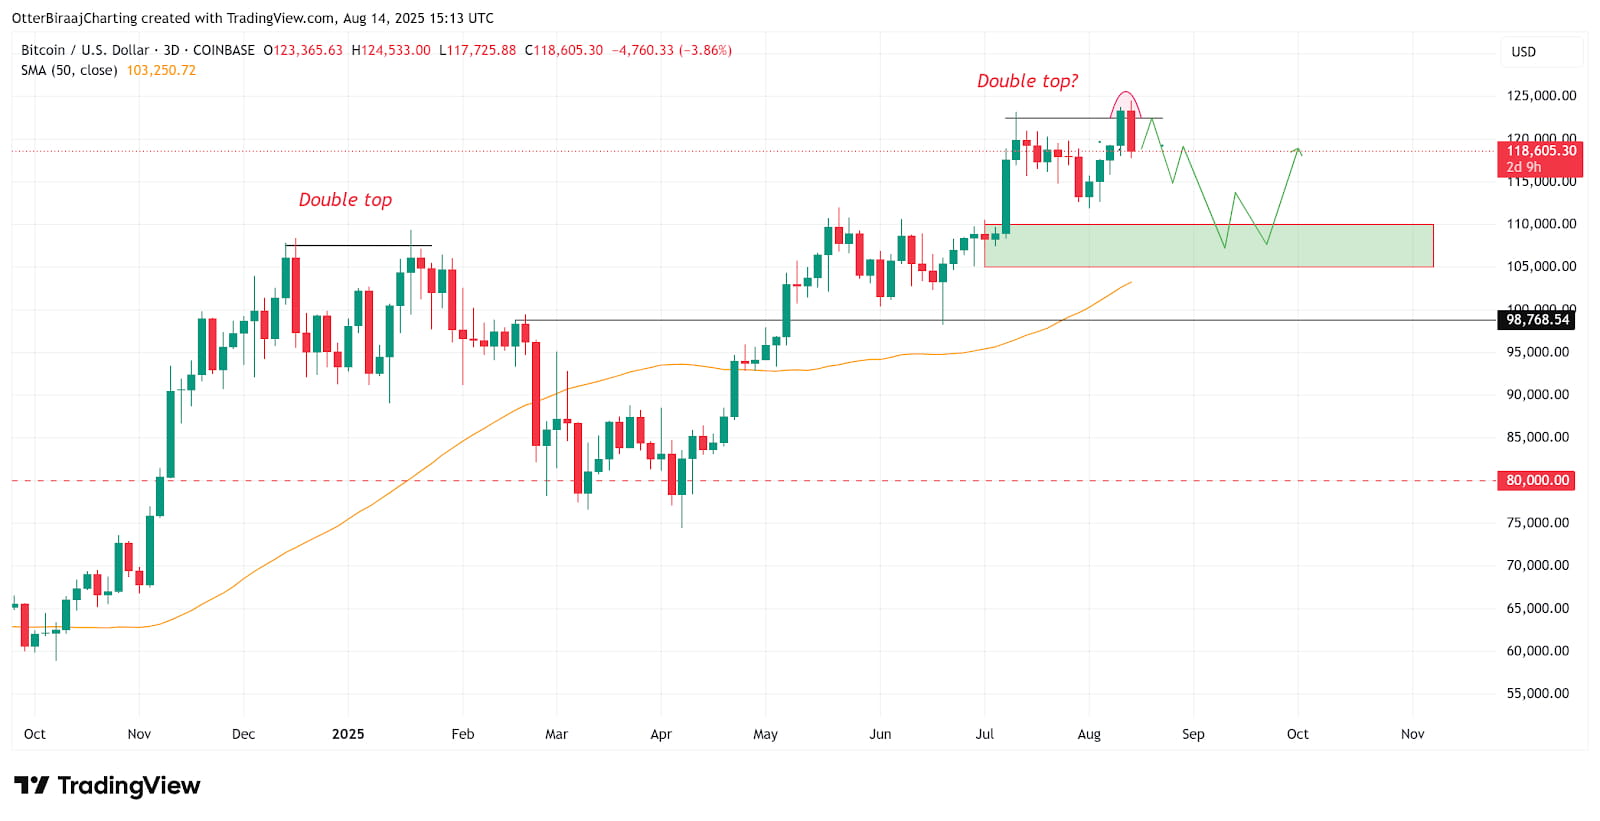 Bitcoin three-day chart. Source: TradingView
Under the cover of macro headwinds, Bitcoin's own technical structure had already harbored murderous intent. When the price broke through $123,000 to hit a historical high, the Relative Strength Index (RSI) showed a bearish divergence, suggesting that the upward momentum was exhausted. A more severe signal came from the three-day chart -- Bitcoin formed a prominent double top pattern, a structure that triggered a 35% plunge in January 2025.
Psychological Game of Key Support Levels
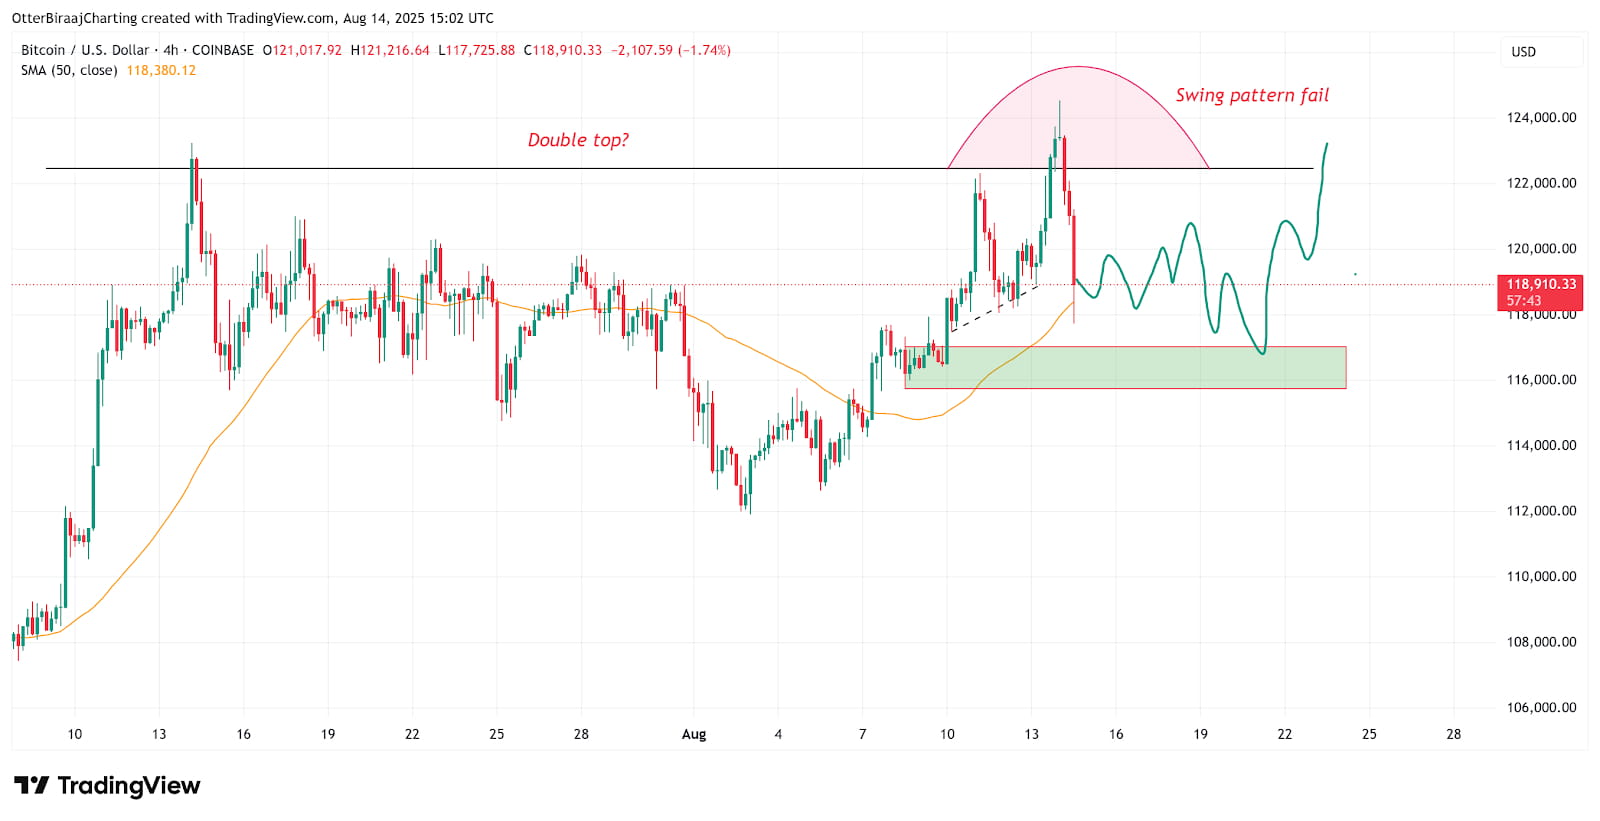 Bitcoin four-hour chart. Source: Cointelegraph
Market structure staged a life-and-death game at the $117,500 level. Once this key internal liquidity area, which is closely watched by technical traders, is lost, it immediately triggers a chain reaction of programmed sell orders. On the four-hour chart, the appearance of a swing failure pattern indicates that the market will enter a high-volatility oscillating phase. Currently, $112,000 has become a watershed for bulls and bears. If it is effectively broken, it may trigger a deep correction to the $105,000-$110,000 area.
Death Spiral of Leverage Liquidation
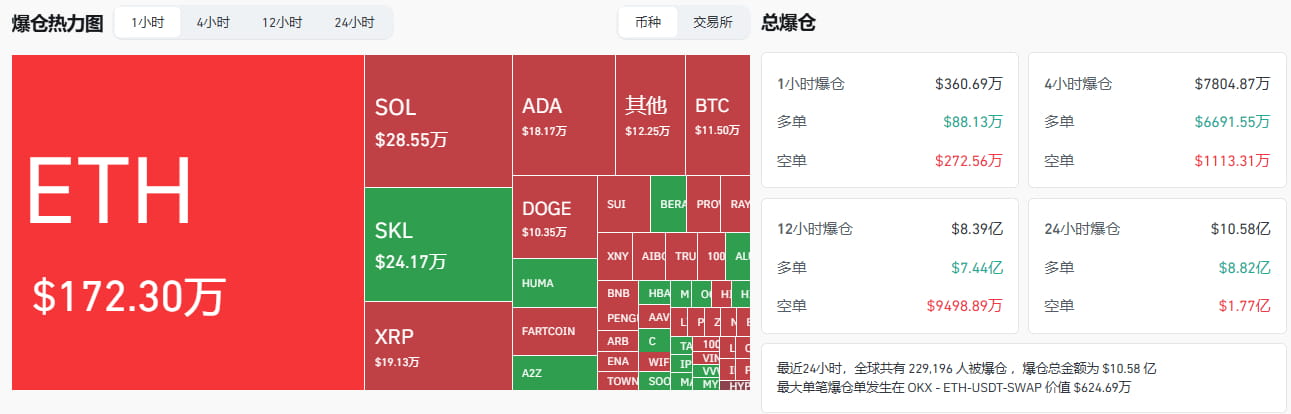
The most tragic in the crash were the leveraged bulls. When Bitcoin fell below $117,500, up to $880 million in long positions were forcibly liquidated within 24 hours, forming a 'long squeeze' stampede. This passive selling, dominated by futures contracts, further amplified the decline in the spot market, turning the correction into a mini-crash.
The Calm Paradox of the Derivatives Market
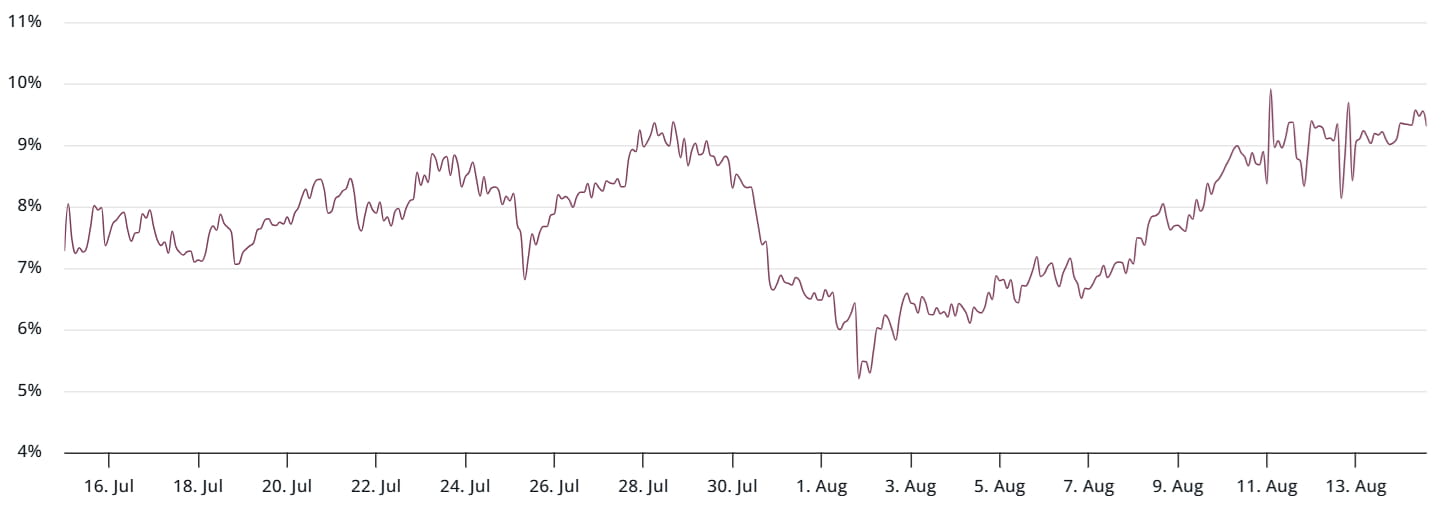 BTC 3-month futures annualized premium. Source: laevitas.ch
In stark contrast to the panic in the spot and futures markets, professional derivative traders showed amazing composure. The Bitcoin futures annualized premium is stable at 9%, holding firm in the neutral range of 5%-10%. This indicator proves that the historical high was not driven by excessive leverage, and professional funds are still cautiously optimistic about the medium-term trend.
The Confidence Code of the Options Market
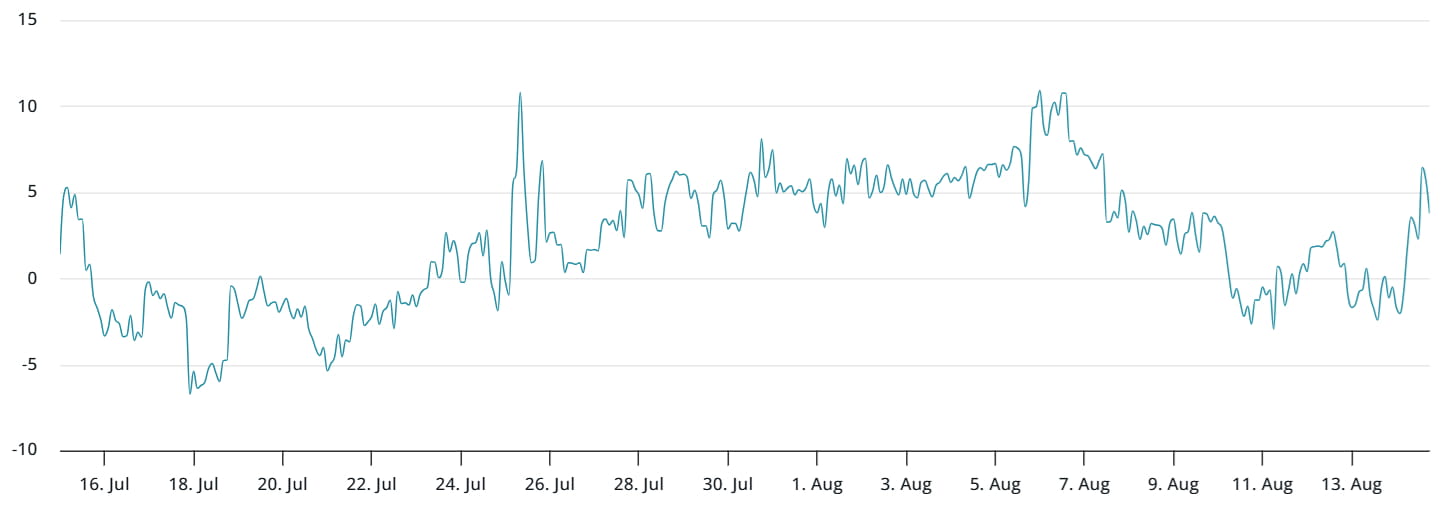 Deribit Bitcoin 30-day Option Delta Skew (bearish-bullish). Source: laevitas.ch
The real confidence indicator comes from the options market. Despite the violent price fluctuations, Bitcoin's 30-day option Delta skew is only 3%, far below the 6% bearish threshold. This means that institutional investors have not massively bought put options to hedge risks, and the core market sentiment is still neutral to strong. This divergence of sentiment between professional investors and retail investors reveals the difference in judgment of the nature of the crash by different market participants -- professional traders see it as a healthy adjustment, while retail investors are caught in panic selling.
Whales' Contrarian Operation
On-chain data exposed the movements of smart money. Whale addresses holding more than 1,000 BTC took advantage of the plunge to cumulatively buy 18,000 Bitcoins, with costs concentrated in the $118,000 - $120,000 range. This contrarian layout of 'smart money' laid the groundwork for a market rebound.
In-Depth Analysis of Structural Contradictions
This round of Bitcoin's correction exposed the deep contradictions in its market structure. When the Fed minutes released signals of interest rate cuts and the S&P 500 hit a record high, Bitcoin weakened on its own, revealing that its risk asset attribute still dominates. Despite being given the 'digital gold' halo, Bitcoin, in actual market fluctuations, often behaves more like a tech stock substitute, highly correlated with traditional risk assets.
The Lag Effect of Liquidity Transmission
There is a high correlation of 0.94 between global M2 money supply growth and Bitcoin prices, but liquidity transmission takes time. When the Fed reduces quantitative tightening and market liquidity expectations improve, Bitcoin's sensitivity to policies has decreased, and it is more directly responsive to changes in the 'real interest rate'. This change in the monetary transmission mechanism makes Bitcoin more susceptible to short-term emotional shocks during policy window periods.
Hedging Demand in Emerging Markets
Noteworthy regional changes have appeared in the Latin American market. Trump's tariff policy has triggered capital flight from emerging markets such as Brazil and Mexico, and Bitcoin trading volume in these regions has surged by 40%. When the local fiat currency faces devaluation pressure, Bitcoin's 'capital flight tool' attribute becomes prominent, and this structural demand provides invisible support for the price.
This flash crash exposed Bitcoin's vulnerability as an emerging asset -- when inflation data reverses, policy expectations fail, and technical aspects deteriorate, forming a triple resonance, even if derivative indicators are stable, it is difficult to resist the spread of panic. The whales, however, quietly acted at this moment, absorbing chips at a cost of $105,000 to $108,000, sowing seeds for the next round of market.
The market's attention is now focused on the key support level of $112,000, which is not only a watershed for bulls and bears, but will also test whether Bitcoin can maintain the narrative logic of 'digital gold'. As the Fed's September rate cut window approaches, and the U.S. (GENIUS Act) and other regulatory frameworks are implemented, this plunge caused by the inflation ghost may eventually become a cruel coming-of-age ceremony for Bitcoin to become a mature financial asset.


