

Bitcoin shows signs of solidifying its strong upward momentum with positive on-chain indicators, a favorable Funding Rate, and significantly increased derivative activity, implying that a new bullish cycle may continue.
With NVT Golden Cross declining sharply, a positive Funding Rate maintained, and increasing derivative liquidity, Bitcoin is approaching a growth cycle, as reflected by the history of previous bull markets.
MAIN CONTENT
The NVT Golden Cross indicator and netflow on the exchange signal that Bitcoin may soon enter a strong new bullish phase.
A continuously positive Funding Rate indicates strong confidence from leveraged traders.
Increased derivative activity and liquidation of long positions push liquidity and volatility to high levels, reinforcing price increases.
Is Bitcoin in a consolidation phase and what signals indicate a breakout is imminent?
After reaching its ATH, indicators such as bullish netflow, compressed NVT Golden Cross, positive Funding Rate, and surging derivatives show strong growth momentum for Bitcoin.
"Traditional on-chain indicators such as NVT Golden Cross often play a key role in identifying significant accumulation phases before Bitcoin enters a parabolic growth cycle."
CryptoQuant Report, 2025
Since early August, the Bitcoin netflow indicator has recorded a bottom similar to the patterns in 2017 and 2021. These lows often mark the beginning of a final acceleration phase in previous bull markets. On August 13, Bitcoin reached a new peak of $124,457 before correcting to $120,895. The sell-off from long-term investors has noticeably decreased, indicating that scarce supply will drive prices higher in the coming weeks.
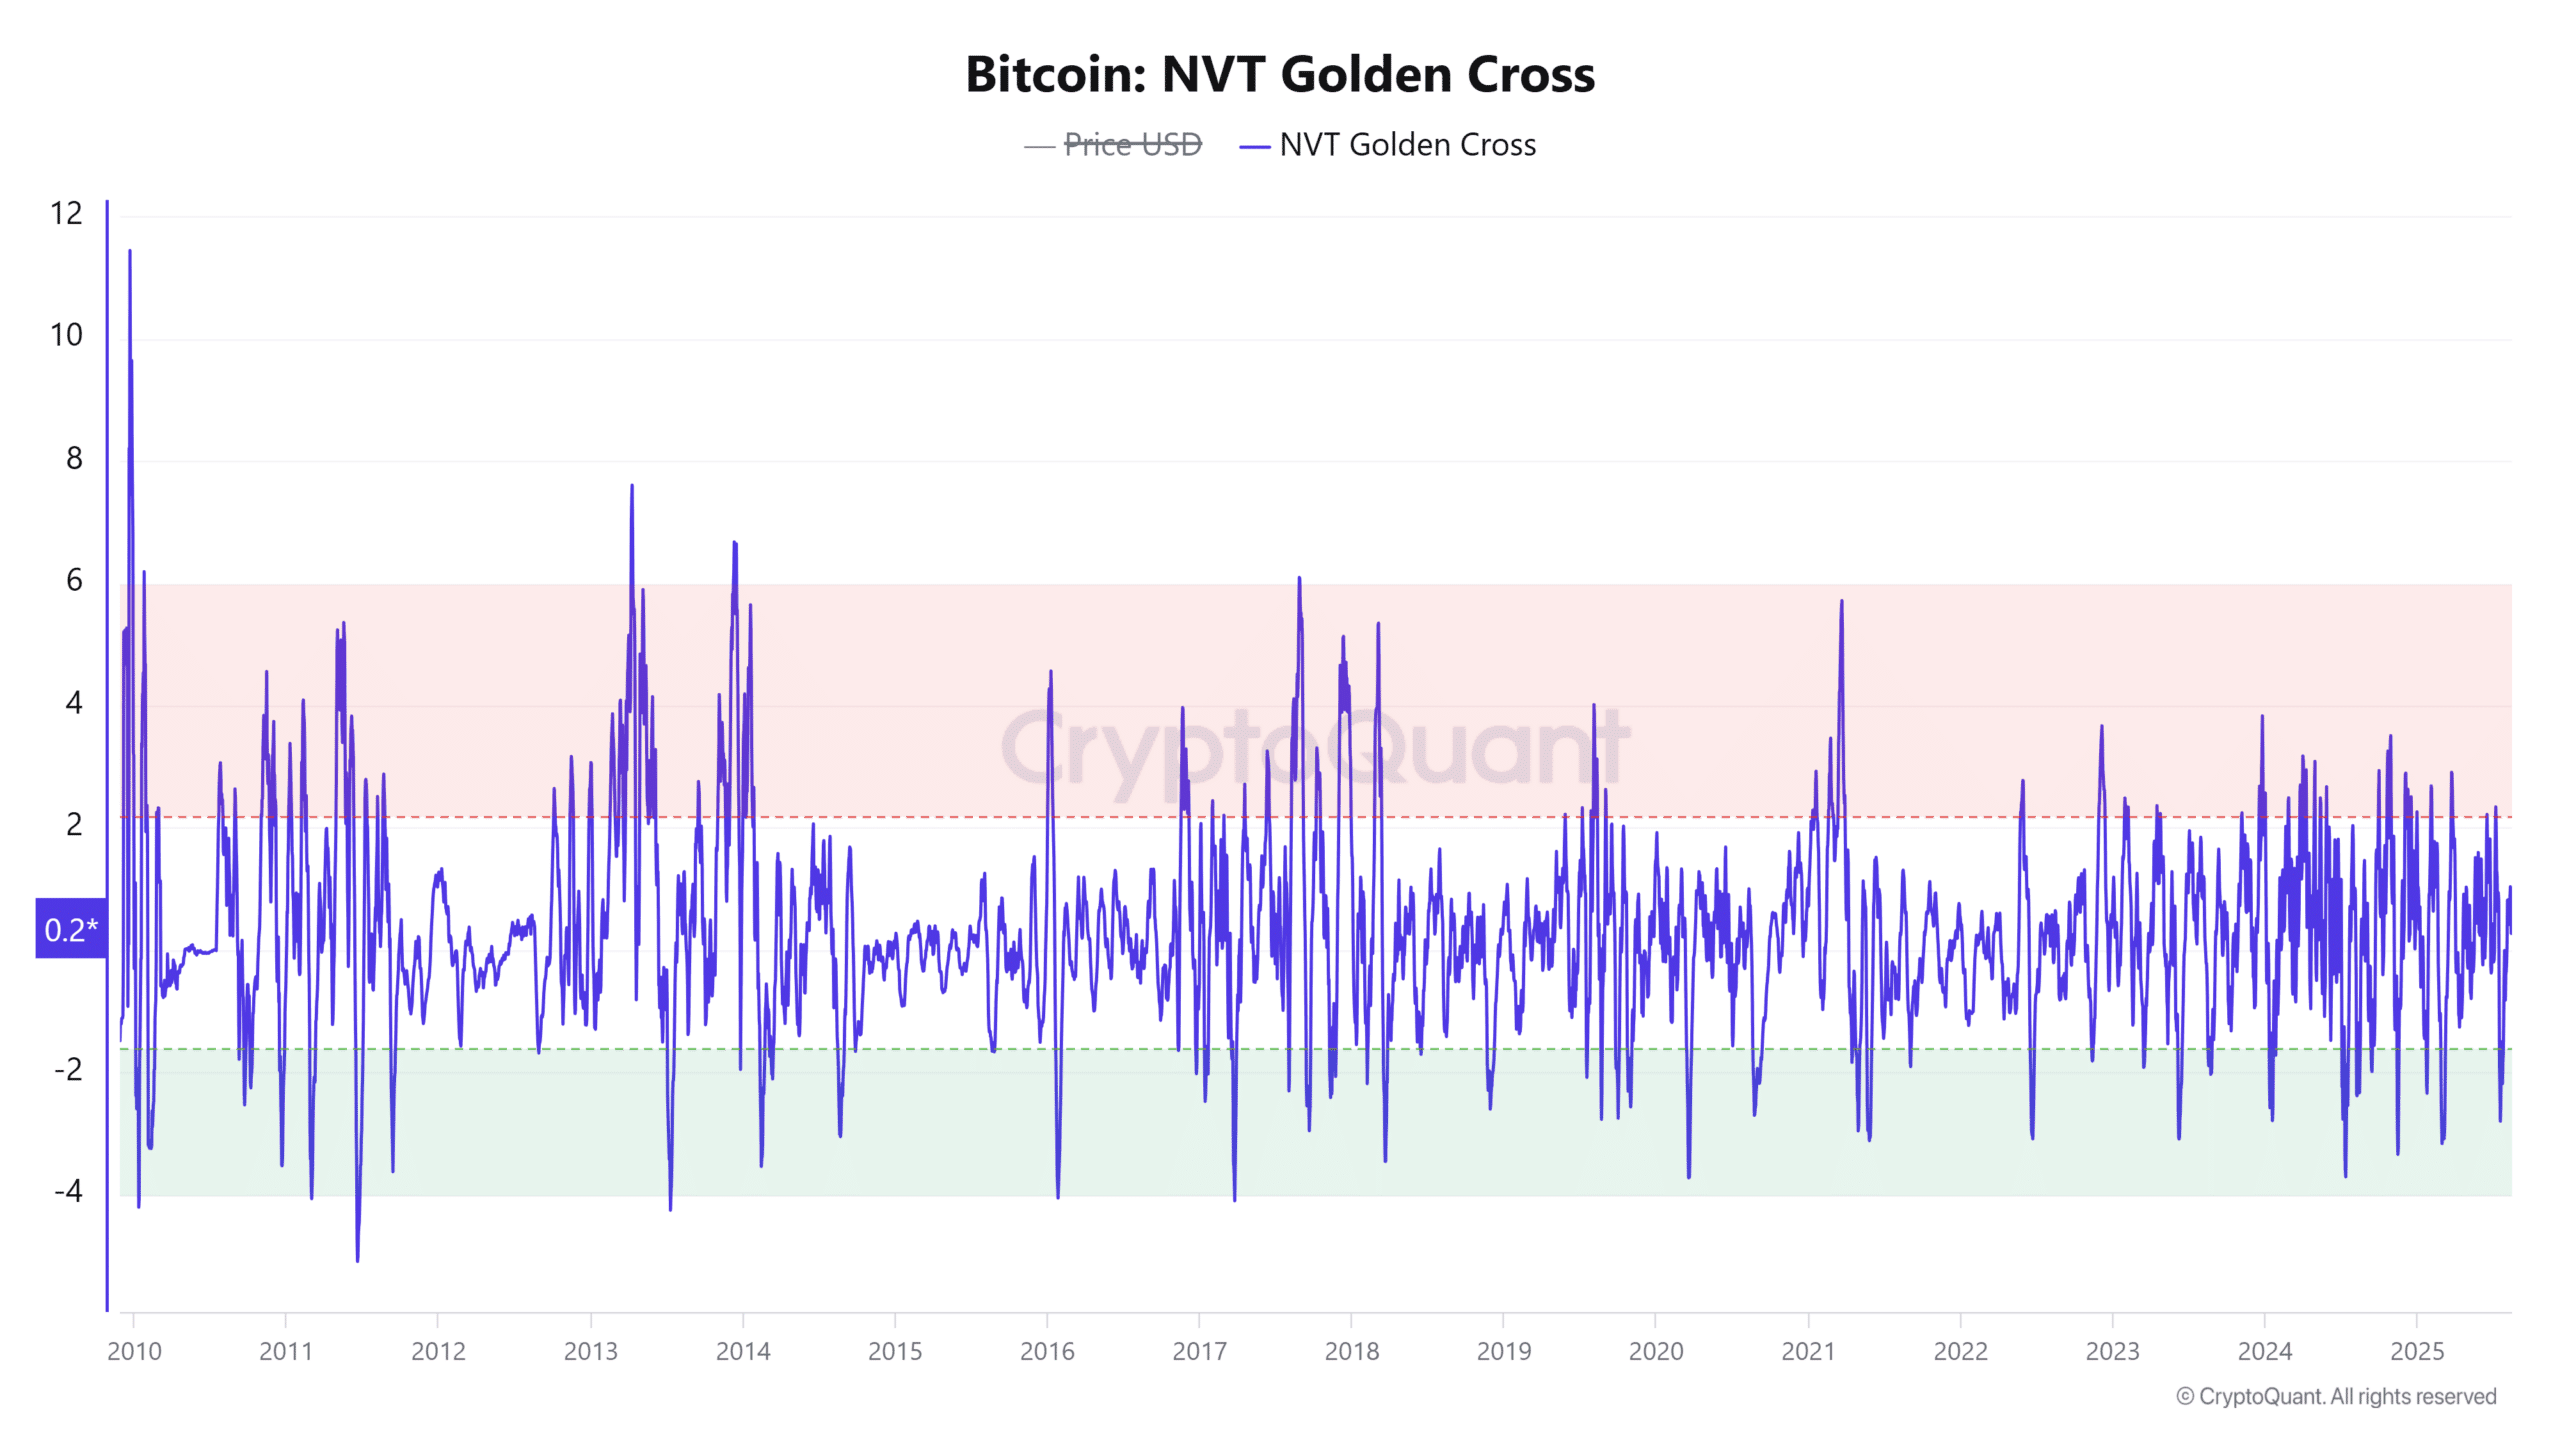
What is NVT Golden Cross and does it signal market reversals?
As of the writing of this article, the NVT Golden Cross recorded 0.2709, down 53.92%, implying significantly lower capitalization compared to the network's transaction value.
"The deep decline of NVT Golden Cross often precedes strong growth cycles, as the network is undervalued relative to its trading strength."
CryptoQuant Insights, August 2025
History shows that such strong corrections often coincide with bottom regions – a precursor to spectacular recoveries. When NVT declines sharply while trading volume increases, Bitcoin's price tends to show recovery signs afterward, as market sentiment recognizes that Bitcoin is undervalued.
The current compression of the NVT Golden Cross indicator increases the likelihood of a new buying wave. This is a notable technical indicator, especially for professional traders who need to closely monitor it to capitalize on reversal opportunities.
Source: CryptoQuant
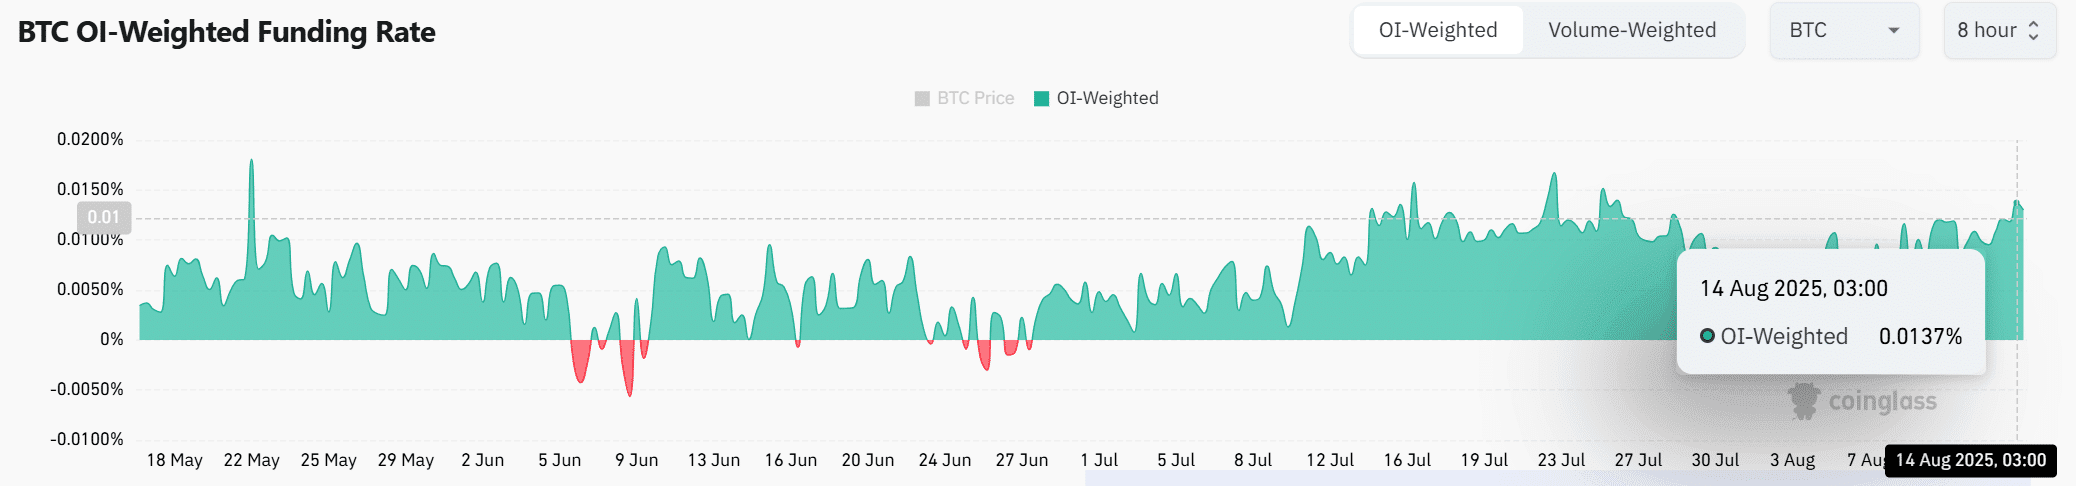
Does a continuously positive Funding Rate reinforce Bitcoin's bullish trend?
At the time of recording, Bitcoin's OI-weighted Funding Rate reached 0.0137%, reflecting stable positive sentiment from leveraged traders.
"A reasonable positive Funding Rate not only reflects market optimism but also serves as a 'buffer' to maintain upward momentum if no signs of overload in long positions appear."
CoinGlass, data as of August 14, 2025
When the Funding Rate continues to remain at a reasonable level, investors are willing to pay a premium to maintain long positions, indicating strong confidence in the ongoing bullish trend. This contributes to price stability and attracts additional new capital. However, if the Funding Rate suddenly spikes, it may signal that the market is skewed towards longs and the risk of a correction arises. Currently, the Funding Rate remains stable – a signal supporting the short- to medium-term bullish trend without the risk of excessive leverage.
Source: CoinGlass
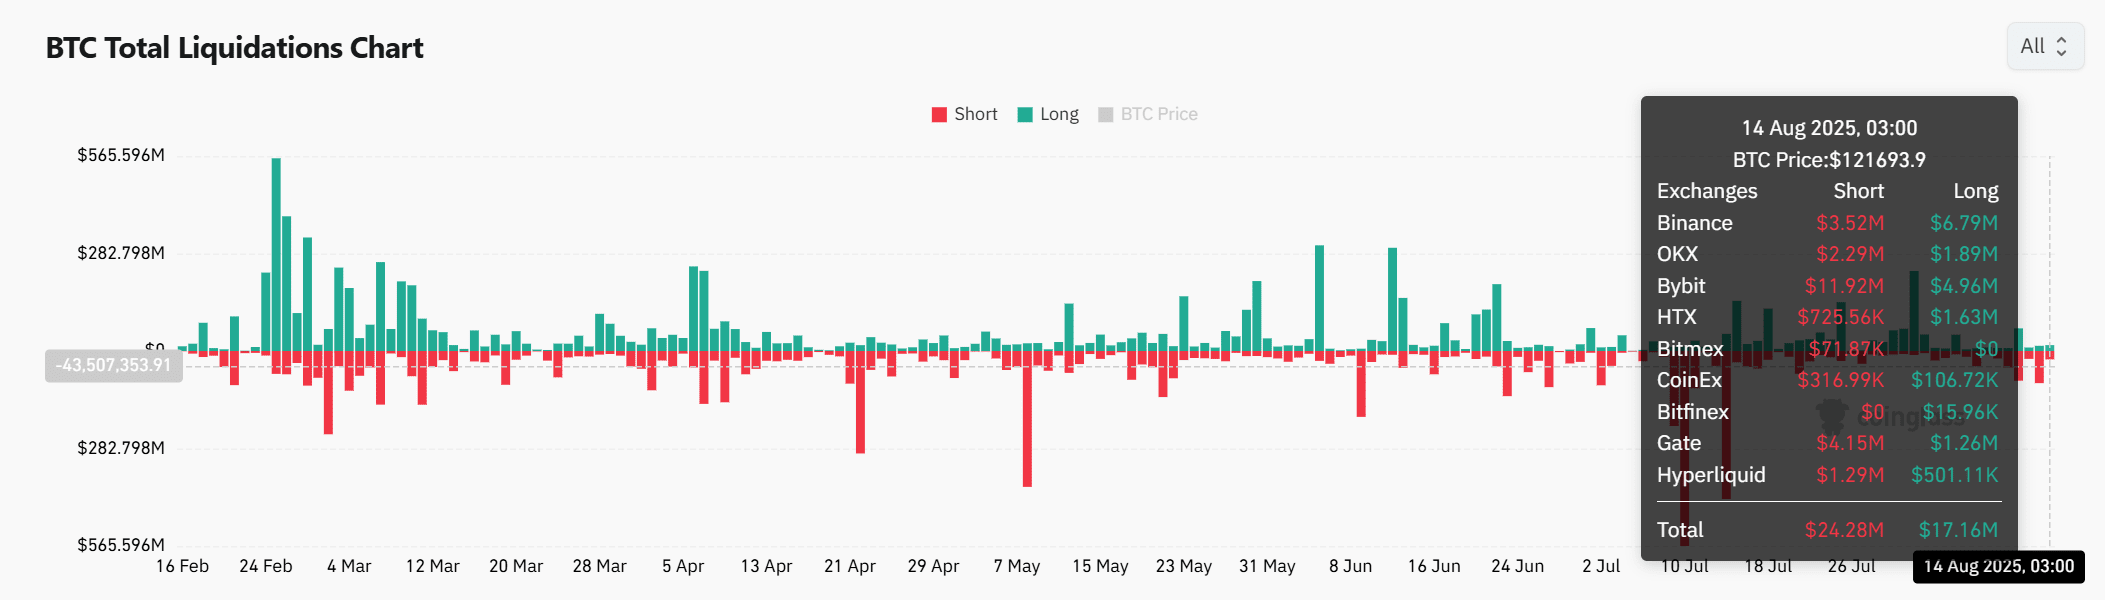
What does derivative data and short position liquidation indicate?
In the past 24 hours, Bitcoin recorded $24.28 million in short positions liquidated, higher than the $17.16 million in long positions liquidated, implying that short sellers were forced to close losing positions.
"Large liquidations in short positions and a surge in derivative volume indicate significant capital inflow into the market, creating a typical vibrant phase before large bull runs."
CoinGlass, August 14, 2025
At the same time, derivative indicators surged: trading volume jumped 65.37% to $149.47 billion, Open Interest reached $83.76 billion (up 4.14%), Options volume increased 127.92% to $9.43 billion, and Options OI rose 5.19% to $57.15 billion. The participation of both financial institutions and individual investors significantly boosts liquidity and price volatility, pushing Bitcoin closer to its historical ATH.
Source: CoinGlass
Comparing Bitcoin derivatives data during growth phases
Accumulation Phase Indicator Bull Market Preparation Phase (current) Derivative Trading Volume Under $50 billion/day $149.47 billion/day Open Interest Approximately $30-50 billion $83.76 billion Funding Rate Fee Neutral or low Positive and stable (0.0137%) Short Position Liquidation Usually low, evenly distributed $24.28 million in 24h
Conclusion: Is Bitcoin preparing to enter a new growth phase?
The combination of positive netflow signals, compressed NVT Golden Cross, a maintained positive Funding Rate, and explosive activity in derivatives is creating a clear bullish scenario for Bitcoin. Historical data and real-time statistics reinforce the possibility that Bitcoin may enter the next parabolic growth phase, extending its record-high gains.
Frequently asked questions about the state of the Bitcoin market
What is NVT Golden Cross and how reliable is it for reversal signals?
NVT Golden Cross is an on-chain indicator analyzing the market capitalization ratio to transaction volume. When this index declines sharply, history shows it often coincides with market bottoms before bull runs.
What impact does a positive Funding Rate have on Bitcoin's price?
A positive Funding Rate reflects traders' confidence in the upward trend, supporting stable prices and increasing buying momentum.
Does a large short position liquidation indicate a price pump?
When the liquidation of short positions increases and Bitcoin's price rises, buying pressure can escalate quickly, creating a strong price pump as opponents must buy back to close positions.
When should we be cautious about the Funding Rate?
If the Funding Rate increases too quickly and abnormally high, the market may skew towards longs and could easily see sharp downward corrections.
What does netflow data on the exchange indicate?
Low netflow and a decrease in long-term holder sell-offs often signal a scarcity of supply, potentially indicating a breakout price surge ahead.
What does a surge in derivative data signify?
A strong increase in volume and Open Interest in derivatives often accompanies high volatility, attracting both institutions and retail investors into the market.
Will Bitcoin continue to maintain its upward trajectory to new highs?
Current indicators all reinforce a bullish scenario; however, volatility remains high, and investors need to manage risks stringently.
Source: https://tintucbitcoin.com/bitcoin-dieu-chinh-da-tang-con-tiep/
Thank you for reading this article!
Please Like, Comment, and Follow TinTucBitcoin to stay updated with the latest news about the cryptocurrency market and not miss any important information!
