1. Technical Analysis
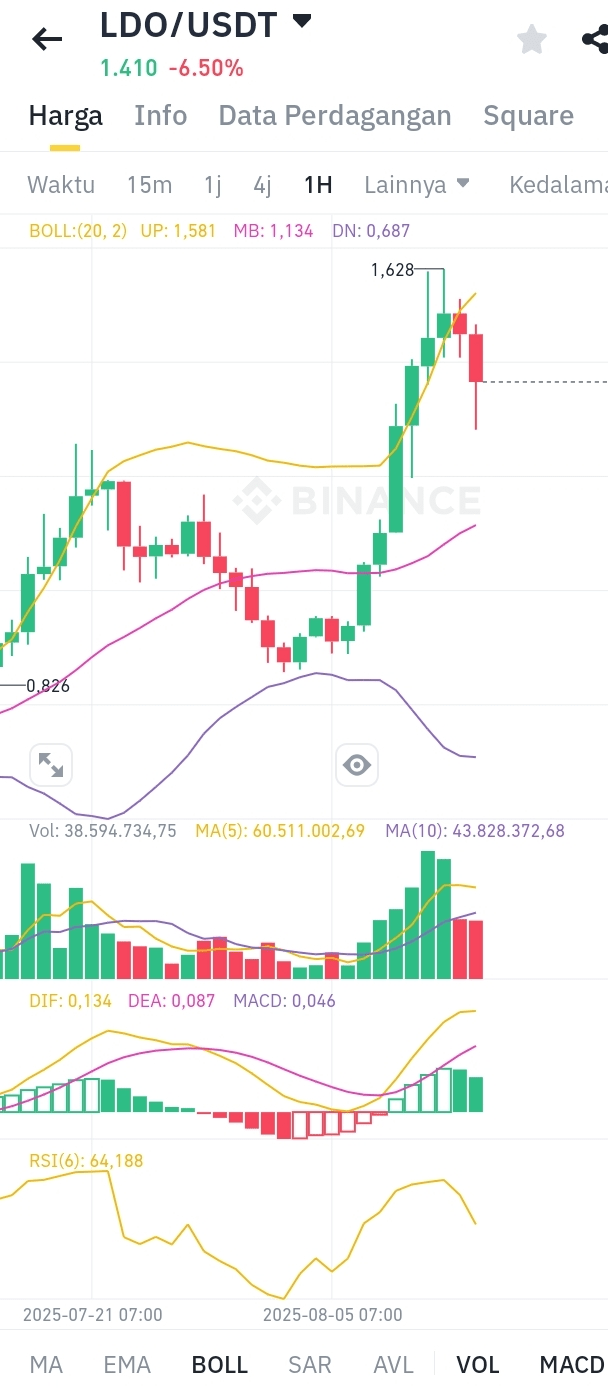
Current Price: 1.410 USDT (-6.50%).
Bollinger Bands Indicator (20,2):
Upper Band (UP): 1.581 (resistance).
Middle Band (MB): 1.134 (dynamic support).
Lower Band (DN): 0.687 (strong support).
Trading Volume: 38.594M, below MA(5) (60.511M) and MA(10) (43.828M), indicating a decrease in short-term buying interest.
RSI(6): 64.188 (approaching overbought, but not extreme yet).
MACD: DIF (0.134) > DEA (0.087), with a positive histogram (0.046), indicating short-term bullish momentum.
2. Important Levels
Resistance: 1.448 → 1.581 (Upper Bollinger Band).
Support: 1.410 (current price) → 1.228 → 1.134 (Middle Band).
Distant Support: 0.687 (Lower Band).
3. Market Sentiment
The price drop of -6.50% reflects selling pressure, but RSI and MACD still show potential recovery if support 1.410 holds.
Trading Strategy
A. For Short-Term Traders (Scalping/Intraday)
Buy Signal:
If the price bounces from support 1.410 with a confirmation of high volume.
Target: 1.448 (minor resistance) or 1.581 (Upper Bollinger Band).
Stop-loss: Below 1.228 (if the price drops more than 5% from entry).
Sell Signal:
If the price fails to break 1.448 and RSI drops below 60.
Target: 1.228 → 1.134.
Stop-loss: Above 1.480 (if the reversal trend is not confirmed).
B. For Medium-Term Traders (Swing Trading)
Buy Zone:
Accumulate around the Middle Band (1.134) with RSI > 50 and positive MACD confirmation.
Target: 1.581 (UP) or higher if the bullish trend is strong.
Stop-loss: Below 0.900 (if the Lower Band is tested).
Sell Zone:
If the price reaches the Upper Band (1.581) with RSI > 70 (overbought).
Target: 1.410 → 1.228.
Stop-loss: Above 1.620 (if false breakout).
C. Risk Management
Use a minimum risk-reward ratio of 1:2 (example: risk 1%, target 2%).
Avoid trading during low volume (below MA(10)) to prevent low liquidity.
Additional Notes
External Factors: Monitor news related to Lido DAO (LDO), such as protocol updates or changes in ETH staking.
Downward Correction: If the price breaks the Lower Band (0.687), a strong bearish trend may occur. Avoid buying until rebound confirmation.
Summary
Bullish Scenario: Hold if the price is above 1.410 with RSI < 70 and positive MACD.
Bearish Scenario: Sell or short if 1.410 fails to become support and selling volume is high.
Neutral: Wait in the range 1.134–1.581 until a clear breakout.
Use a combination of indicators (Bollinger Bands + RSI + MACD) to confirm signals. Adjust strategies to fit your risk profile!