
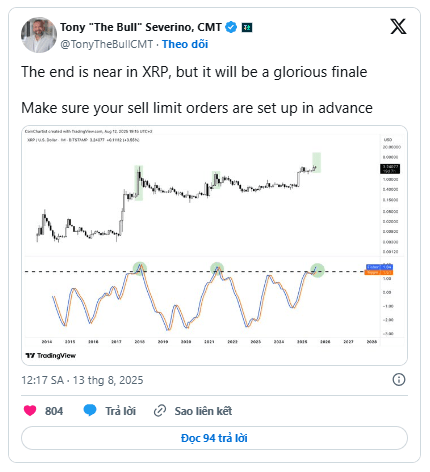
Tony Severino, a veteran trader, is issuing an important warning for XRP holders; that the current price surge may be approaching the "final phase". While optimistic about the token's near-term price potential, he still urges traders to have a clear exit strategy for what he calls the "grand finale".
Severino's latest outlook suggests XRP could complete its "final wave" within 40 days, peaking somewhere between $8 and $13. His analysis indicates this peak will occur by the end of August or early September. This comes amidst other more optimistic forecasts that have suggested high targets ranging from $50 to $99 by the end of this year.
XRP broke out of a multi-year symmetrical triangle model earlier this year, pushing the price to $3.66 in July, the highest since 2018, before returning to the current mark of $3.23. This breakout has positioned the asset to potentially explore price if the upward momentum is maintained.
Risk Scenarios and Historical Correlation
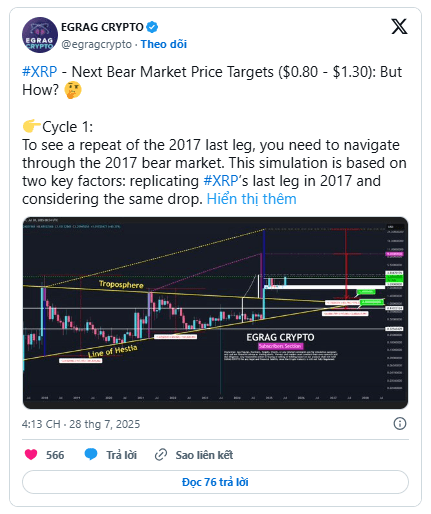
EGRAG, another market analyst, outlined two potential bearish scenarios based on previous market cycles. One project peaked at $27, then dropped 97% to $0.80, similar to the collapse of the 2017–2018 period. The second project forecasts a peak price of $9, then adjusts 85% down to $1.30. He also warns of the possibility of a deeper drop below $0.30 if previous patterns repeat.
Currently, XRP ranks third in market capitalization with $192.01 billion, with a fully diluted valuation of $323.76 billion. The trading volume over the past 24 hours reached $10.25 billion, up 18.17%, corresponding to a trading volume to market cap ratio of 5.34%. The circulating supply stands at 59.3 billion of a total cap of 100 billion tokens.
Technical Signals and Market Momentum
On the daily chart, momentum indicators suggest a cautious outlook. The Relative Strength Index (RSI) is at 56.22, indicating a neutral state and unable to break the bullish threshold of 60-70. Furthermore, the MACD indicator is at 0.0824, below the signal line at 0.0843, leading to a negative chart of -0.0019.
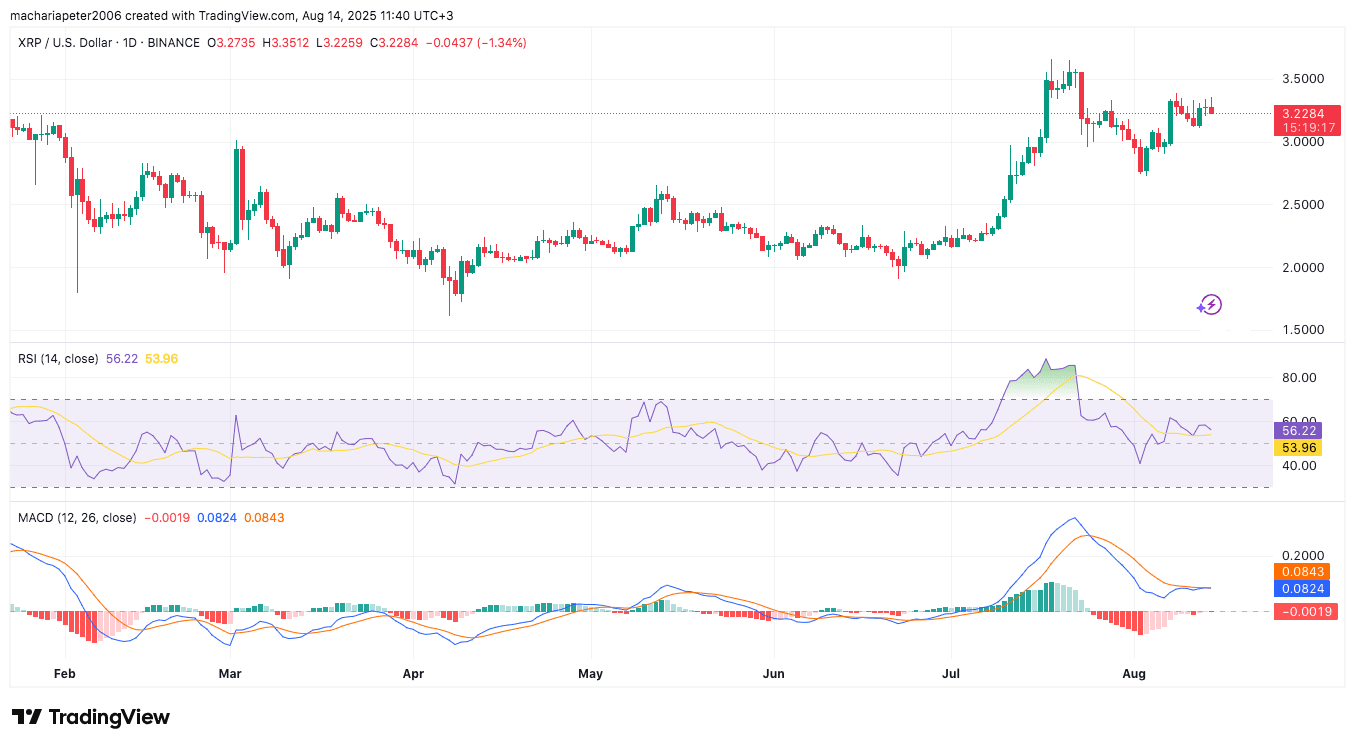
A bullish MACD crossover along with RSI moving above 60 could signal another price rally towards the resistance zone of $3.35–$3.50. However, if momentum is not regained, the price may retest the support level of $3.00.