
Date: Thu, Aug 14, 2025 | 08:50 AM GMT
The cryptocurrency market is in full bullish swing as Bitcoin (BTC) hits a new all-time high of $124,000 today, while Ethereum (ETH) has broken above the $4,700 mark for the first time since 2021, surging over 27% this week. This wave of bullishness has boosted sentiment across the major altcoins, including Starknet (STRK).
This Layer 2 token has recorded an impressive 18% gain over the past week. More importantly, its latest price structure reveals a key harmonic pattern pointing toward further upside potential in the near term.
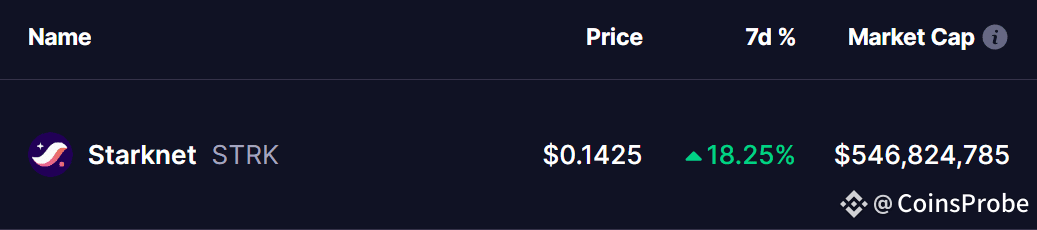
Source: Coinmarketcap
Harmonic Pattern Hints at Bullish Continuation
On the daily chart, $STRK is forming a Bearish Gartley harmonic pattern. Despite the “bearish” label, this formation often precedes strong rallies during the CD leg — typically the most impulsive stage of the move.
The pattern began at point X near $0.1986, fell to point A, retraced to point B, and then declined again to point C around $0.1078. Since then, STRK has rebounded sharply, now trading near $0.1431, reclaiming key price levels and building bullish momentum.
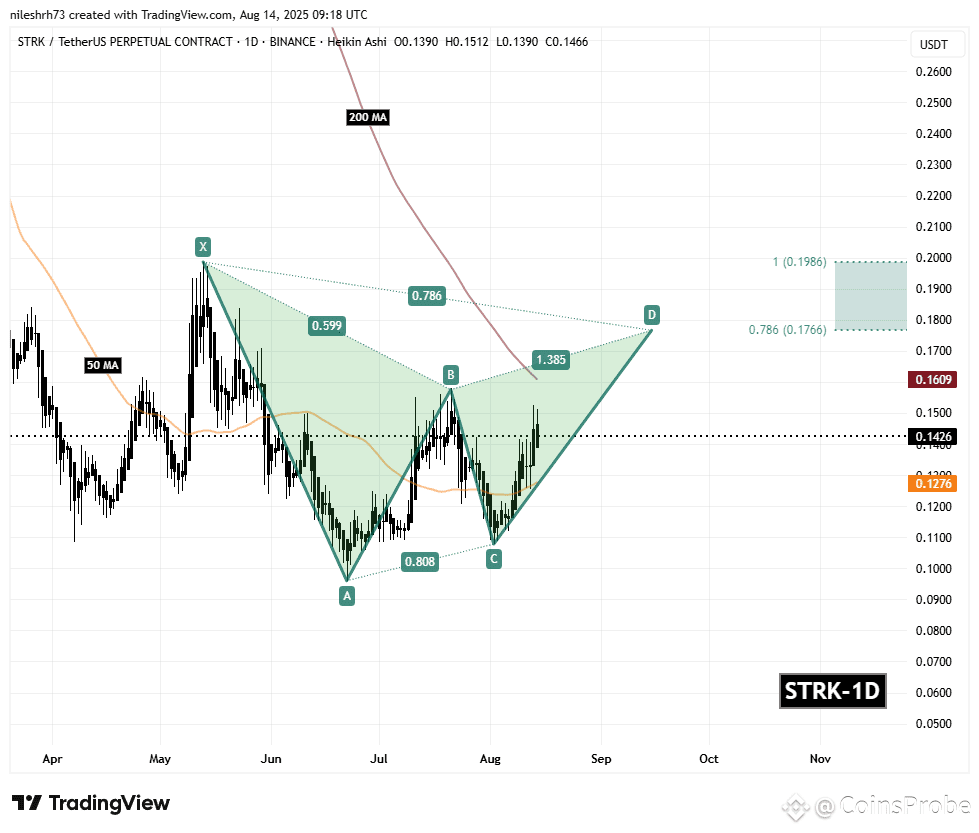
Starknet (STRK) Daily Chart/Coinsprobe (Source: Tradingview)
The immediate challenge for bulls lies at the 200-day moving average ($0.1609) — a major technical barrier that has consistently capped upside attempts in recent months.
What’s Next for STRK?
If buyers can break through the 200-day MA with strong volume, STRK could target its Potential Reversal Zone (PRZ) between $0.1766 and $0.1986. These levels correspond to the 0.786 and 1.0 Fibonacci extensions, where Gartley patterns typically complete before a possible pullback. From the current price, this implies up to 39% potential upside.
However, rejection at the 200-day MA could see STRK retracing toward its 50-day MA ($0.1276) before attempting another breakout.
Disclaimer: This article is for informational purposes only and not financial advice. Always conduct your own research before investing in cryptocurrencies.


