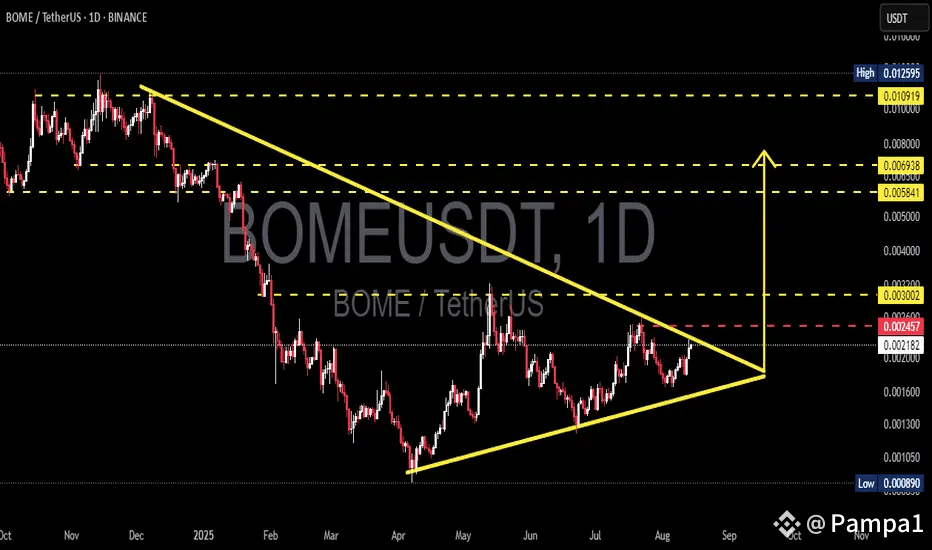
BOME/USDT has entered the crypto arena’s spotlight, coiling tight within a textbook symmetrical triangle pattern—a setup notorious for explosive breakouts. After months of bouncing between falling highs (from the 0.0125 peak) and rising lows (from the April 2025 0.000890 bottom), the token’s volatility is compressing to a decision point, and traders are bracing for fireworks.
## What’s Fueling the Anticipation?
- **Symmetrical triangles** form when neither bulls nor bears can seize control, squeezing the price between converging trendlines. This shrinking range signals escalating pressure and a looming “make or break” scenario[1][5].
- As price action hovers near the critical 0.00245–0.00255 resistance zone, volume is drying up—classic for this pattern’s final phase. When the breakout comes, expect volume to surge and volatility to spike.
## Chart Flashpoints: Key Levels for BOME/USDT
- **Major Resistance:** 0.00245–0.00255 (upper trendline, key breakout zone)
- **Breakout Targets:** 0.003002 (first resistance), then 0.00584–0.00694 (supply zone/next leg), and 0.0109–0.0126 (psychological peak)
- **Support to Watch:** 0.00205–0.00215 (rising trendline), 0.00170–0.00130 (historical supports), with 0.000890 as the last-stand yearly low
## Scenario Showdown: Bulls vs. Bears
- **Bullish Playbook:** A decisive close above 0.00255 with strong volume could unleash a buying frenzy, rapidly targeting 0.003002 and beyond.
- **Bearish Risk:** Failure at resistance followed by a break below 0.00215 opens the door to 0.00200, with deeper drops possible toward 0.00130 or even the 2025 low at 0.000890.
## Pro Insights
Patience is paramount: triangle squeezes often precede rocket-fueled moves. *Wait for a clean, high-volume breakout before jumping in.* For swing traders, this setup offers sharp reward/risk potential—but only for those who respect the boundaries.
***
**Summary:**
The BOME/USDT chart is a powder keg. This symmetrical triangle—months in the making—is now at its edge. When the breakout arrives, it’s going to be loud. Eyes on 0.00255 for the upside trigger and 0.00215 for downside risk. Whatever the outcome, BOME is about to show just how fast volatility can return to the crypto scene[1][5].
Stay sharp. This is why crypto charts matter.