(Analysis based on data from 13.08.2025)
1. Technical Analysis: Symmetrical Triangle and Fractals
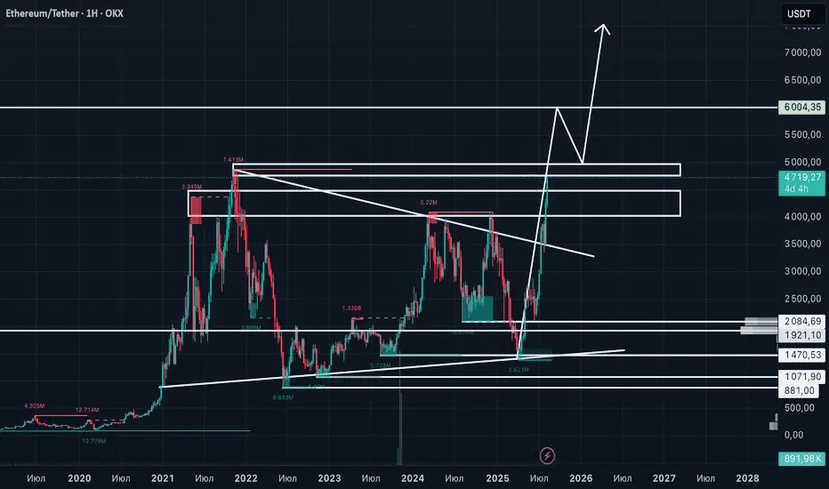
- Pattern: ETH broke the symmetrical triangle on the weekly chart — similar to the situation in 2020 before a +1,200% rise.
- Fibonacci Targets:
- Conservative: $5,600 (161.8% of the triangle height).
- Optimistic: $7,800 (261.8%).
- Fractal Similarity:
- In 2020, after the breakout, ETH rose by 300% in 3 months. The market is repeating the structure now, considering institutional demand (ETFs, corporate reserves).
2. Fundamental Growth Drivers
- Institutional Demand:
- Companies like SharpLink (a MicroStrategy analog for ETH) are buying Ether through OTC transactions, creating a shortage.
- Inflow into ETH-ETF: $2.12 billion for July 2025.
- Supply Deficit:
- After the transition to PoS and burning fees, annual issuance of ETH has decreased by 90%.
Scenarios:
- Base (70%): Growth to $5,600–$7,800 by October with corrections of 15–20%.
- Alternative (30%): Consolidation at $4,000–$4,800 until September before a breakout.
4. Risks
- Macroeconomics: Inflation data (CPI) on 12.08 may increase volatility.
- BTC Correction: If Bitcoin drops below $110K, ETH may pull back to $3,800.
💡 Conclusion
- September-October is the optimal time to enter before the final growth phase.
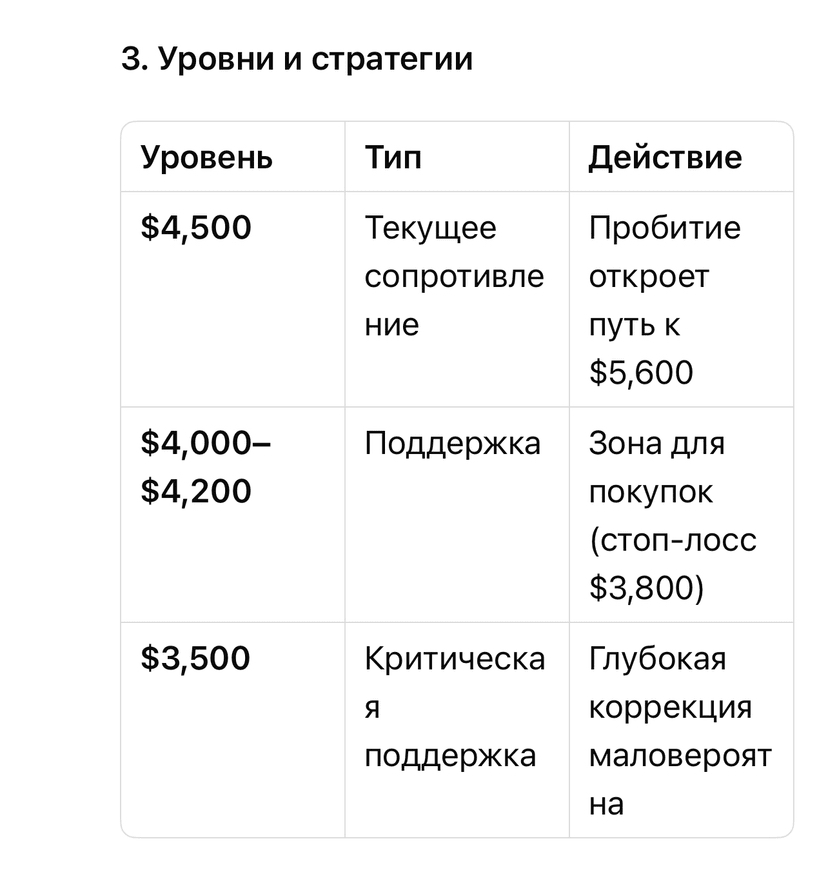
- Main Trigger: Break above $4,500 with volume >$5 billion per day.
- Strategy: Accumulation on pullbacks to $4,200 with targets of $5,600+.
> Remember: Markets move in waves. Even in a bullish trend, corrections are part of the game.